 SECTIONS
PSA Project Scheduling Risk Dashboard
The PSA Project Scheduling Risk dashboard contains the following pages, charts, tables, local filters, and components:
This Dashboard enables you to:
- View a prioritized list of your most risky projects by scheduling variance.
- Track the scheduled versus actual hours variance on your projects and how that has affected the revenue for the last 13 weeks.
- Predict risks to the project schedule for the next 13 weeks based on the hours variance for each resource for the last 13 weeks.
Prerequisites for this Dashboard
Refer to these prerequisites before you start using the Project Scheduling Risk Dashboard.
- Only active projects are included.
- Each project must have at least one week of history in order to be included.
- For any individual resource to be included in the variance calculations, the resource must have at least one week of history on the project.
- You must have at least EvA record of EvA time period type equal to week.
- This dashboard does not support daily bill rates.
| Element Number | Name | Description | Calculation | Referenced Calculation | Source Dataset |
|---|---|---|---|---|---|
|
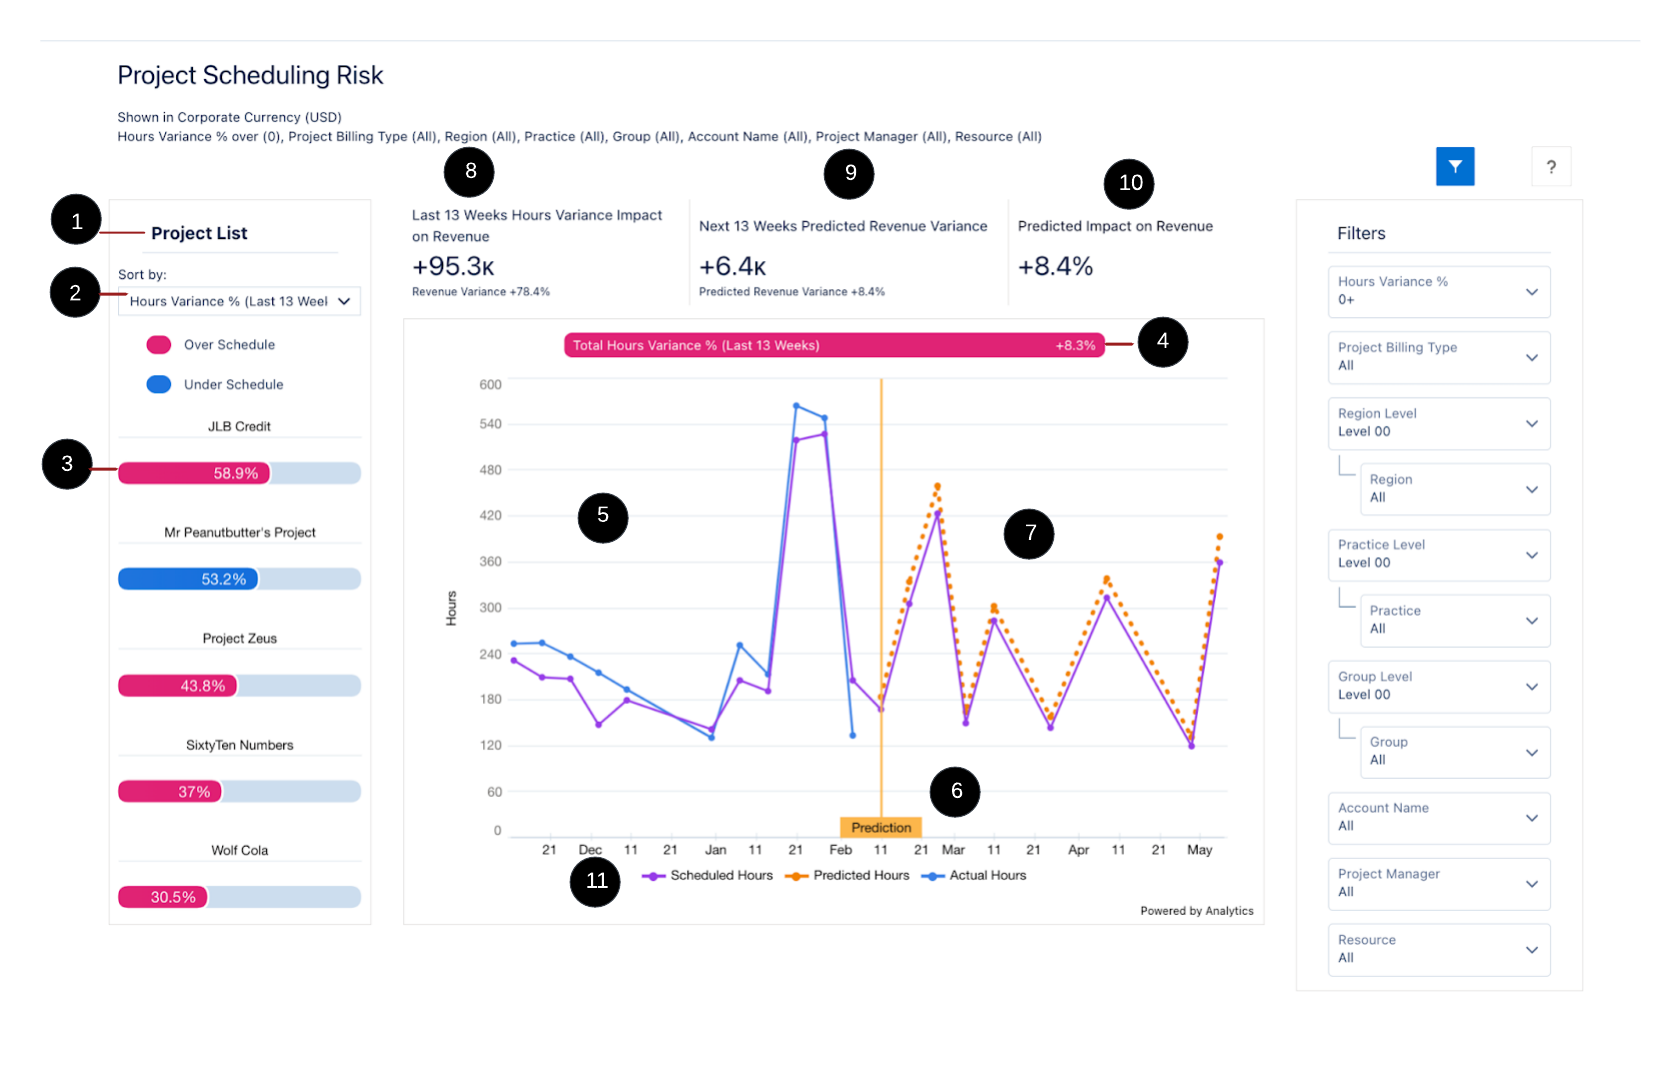
Project List |
A list of your riskiest projects in terms of their schedule inaccuracy. The list reorders according to the selection. |
||||
|
Sort By Picker |
Sorts the project list according to the sort option picked from the list. Note: The project with the highest variance is listed at the top of the project list. |
||||
|
Hours Variance % Last 13 Weeks |
Percentage difference between the scheduled hours and actual hours of the last 13 weeks. |
||||
|
Hours Variance Total Last 13 Weeks |
Total of the difference between the scheduled hours and actual hours of the last 13 weeks. |
||||
|
Scheduled Revenue for Next 13 weeks |
The scheduled revenue for the next 13 weeks retrieved from the EvA records. |
||||
|
Project Variance Bar |
The % variance is calculated on an absolute basis. |
|
This value is derived by calculating the variance per resource, and aggregating to the project level. |
||
|
Over Schedule |
A project is over-scheduled when:
It is represented in pink color. |
||||
|
Under Schedule |
A project is under-schedule when:
It is represented in blue color. |
||||
|
Total Hours Variance % (Last 13 Weeks) |
Consolidated hours variance percentage for the selected project. The colors in the widget are represented in the same way as the legends on the project variance bar. |
|
Or
|
||
|
Line Chart (last 13 weeks) |
Displays the Scheduled Hours and Actual hours in the last 13 weeks. |
Scheduled hours:
Actual Hours:
Revenue Variance:
|
|||
|
Prediction Flag |
The prediction for the next 13 weeks starts from the current week + 12 weeks ahead. |
||||
|
Line chart (next 13 weeks) |
Displays the Scheduled Hours |
Scheduled Hours:
Predicted Hours:
|
|||
|
Last 13 Weeks Hours Variance Impact on Revenue |
Displays hours variance for the last 13 weeks impact on total revenue along with the revenue variance percentage. |
|
|
||
|
Next 13 weeks Predicted Revenue Variance |
Displays revenue variance for the next 13 weeks based on the variance for the last 13 weeks along with the predicted revenue variance percentage. |
Next 13 weeks Predicted Revenue Variance
Next 13 weeks Predicted Revenue
Next 13 weeks Predicted Hours
Next 13 weeks Scheduled Revenue
|
Next 13 weeks Predicted Revenue
Next 13 weeks Scheduled Revenue
Predicted Hours Variance
|
||
|
Predicted Impact on Revenue |
Displays the impact of the selected project’s predicted revenue variance on the total of all projects scheduled revenue in the project list. |
|
Filter: Selected Project/EvA Scheduled Amount Filter: All projects on the dashboard |
||
|
Legends |
|||||
|
Actual Hours |
Total actual hours for the project. |
EvA Actual Hours
|
|||
|
Predicted Hours |
Total predicted hours for the project. This calculation is performed at the resource level and aggregated for the project. The resource's hours average variance % for the past 13 weeks is applied to the scheduled hours for the next 13 weeks, and a predicted hours For example: Resource A had an average of +20% variance for the last 13 weeks and the resource is scheduled for 5 hours per day for the next 13 weeks. So the predicted hours for resource A will be:5*80% = 4 hours per day. The predicted hours |
EVA Estimated Hours - (Average Variance % for last 13 weeks* EVA Estimated Hours)
|
|||
|
Scheduled Hours |
Total scheduled hours across the last 13 weeks and the next 13 weeks. |
EvA Estimated Hours
|
|||
|
Hours Variance % |
The difference between actual and estimated (scheduled) hours as a percentage of estimated hours. |
(EvA Actual Hours - EvA Estimated Hours ValueEVATotalHour) / EvA Actual Hours
|
|||
The PSA Project Scheduling Risk dashboard displays data from the Project Reporting dataset.
For more details about the fields used by the PSA Project Scheduling Risk dashboard, see Project Reporting Dataset Output Fields.
Filters
The filters panel can be used to tailor the data displayed in the dashboard.
|
Name |
Description |
Filter Source Information |
|---|---|---|
|
Hour Variance % |
Displays the past 13 weeks variance of scheduled versus actual hours. It filters out projects which have a variance below this threshold. The variance is listed as an absolute value in this filter. |
Fixed list: |
|
Project Billing Type |
Displays data based on billing type. |
Dataset Field: |
|
Region Level |
Displays available levels for regions. |
|
|
Region |
Displays regions at the level selected in Region Level. |
Uses field selected in Region Level, shows all values available, and Global Region. |
|
Practice Level |
Displays available levels for practices |
|
|
Practice |
Displays practices at the level selected in Practice Level. |
Uses the field selected in Practice Level, shows all values available, and Global Practice. |
|
Group Level |
Displays available levels for groups. |
|
|
Group |
Displays groups at the level selected in Group Level. |
Uses the field selected in Group Level, shows all values available, and Global Group. |
|
Project |
Displays data for a specified project. |
|
|
Account Name |
Displays the data for a specified account name. |
|
|
Project Manager Name |
Displays the data for a specified project manager name. |
|
|
Resource |
Displays the data for a specified resource name. |
|
This dashboard is designed to complement the enhanced Project Management Workspace functionality available in PSA. For more information on this functionality, see the PSA Help.
The dashboard is available only on the PS Cloud Advanced Analytics app.
Suggested Use Cases
You can explore and view the data displayed in this dashboard to analyze the trends and take critical business decisions such as:
- Prioritize the projects that have the most variance or have caused the most impact on revenue at a glance.
- Track the changes in hour variance in the last 13 weeks for problematic projects.
- Predict the hour variance in the next 13 weeks based on the hour variance in the last 13 weeks.
- Take necessary actions to mitigate the hour variance in the future and reduce its impact on project revenue.
Use case for Fixed fee projects
- Fixed Fee projects are those that have a fixed revenue. The hours variance in these projects do not have an impact on revenue. However, if resources work more and submit timecards with more hours than the scheduled hours then the project margin will be lower.
- To filter the projects on the basis of Fixed Fee, on the Project Billing Type option select Fixed Fee.