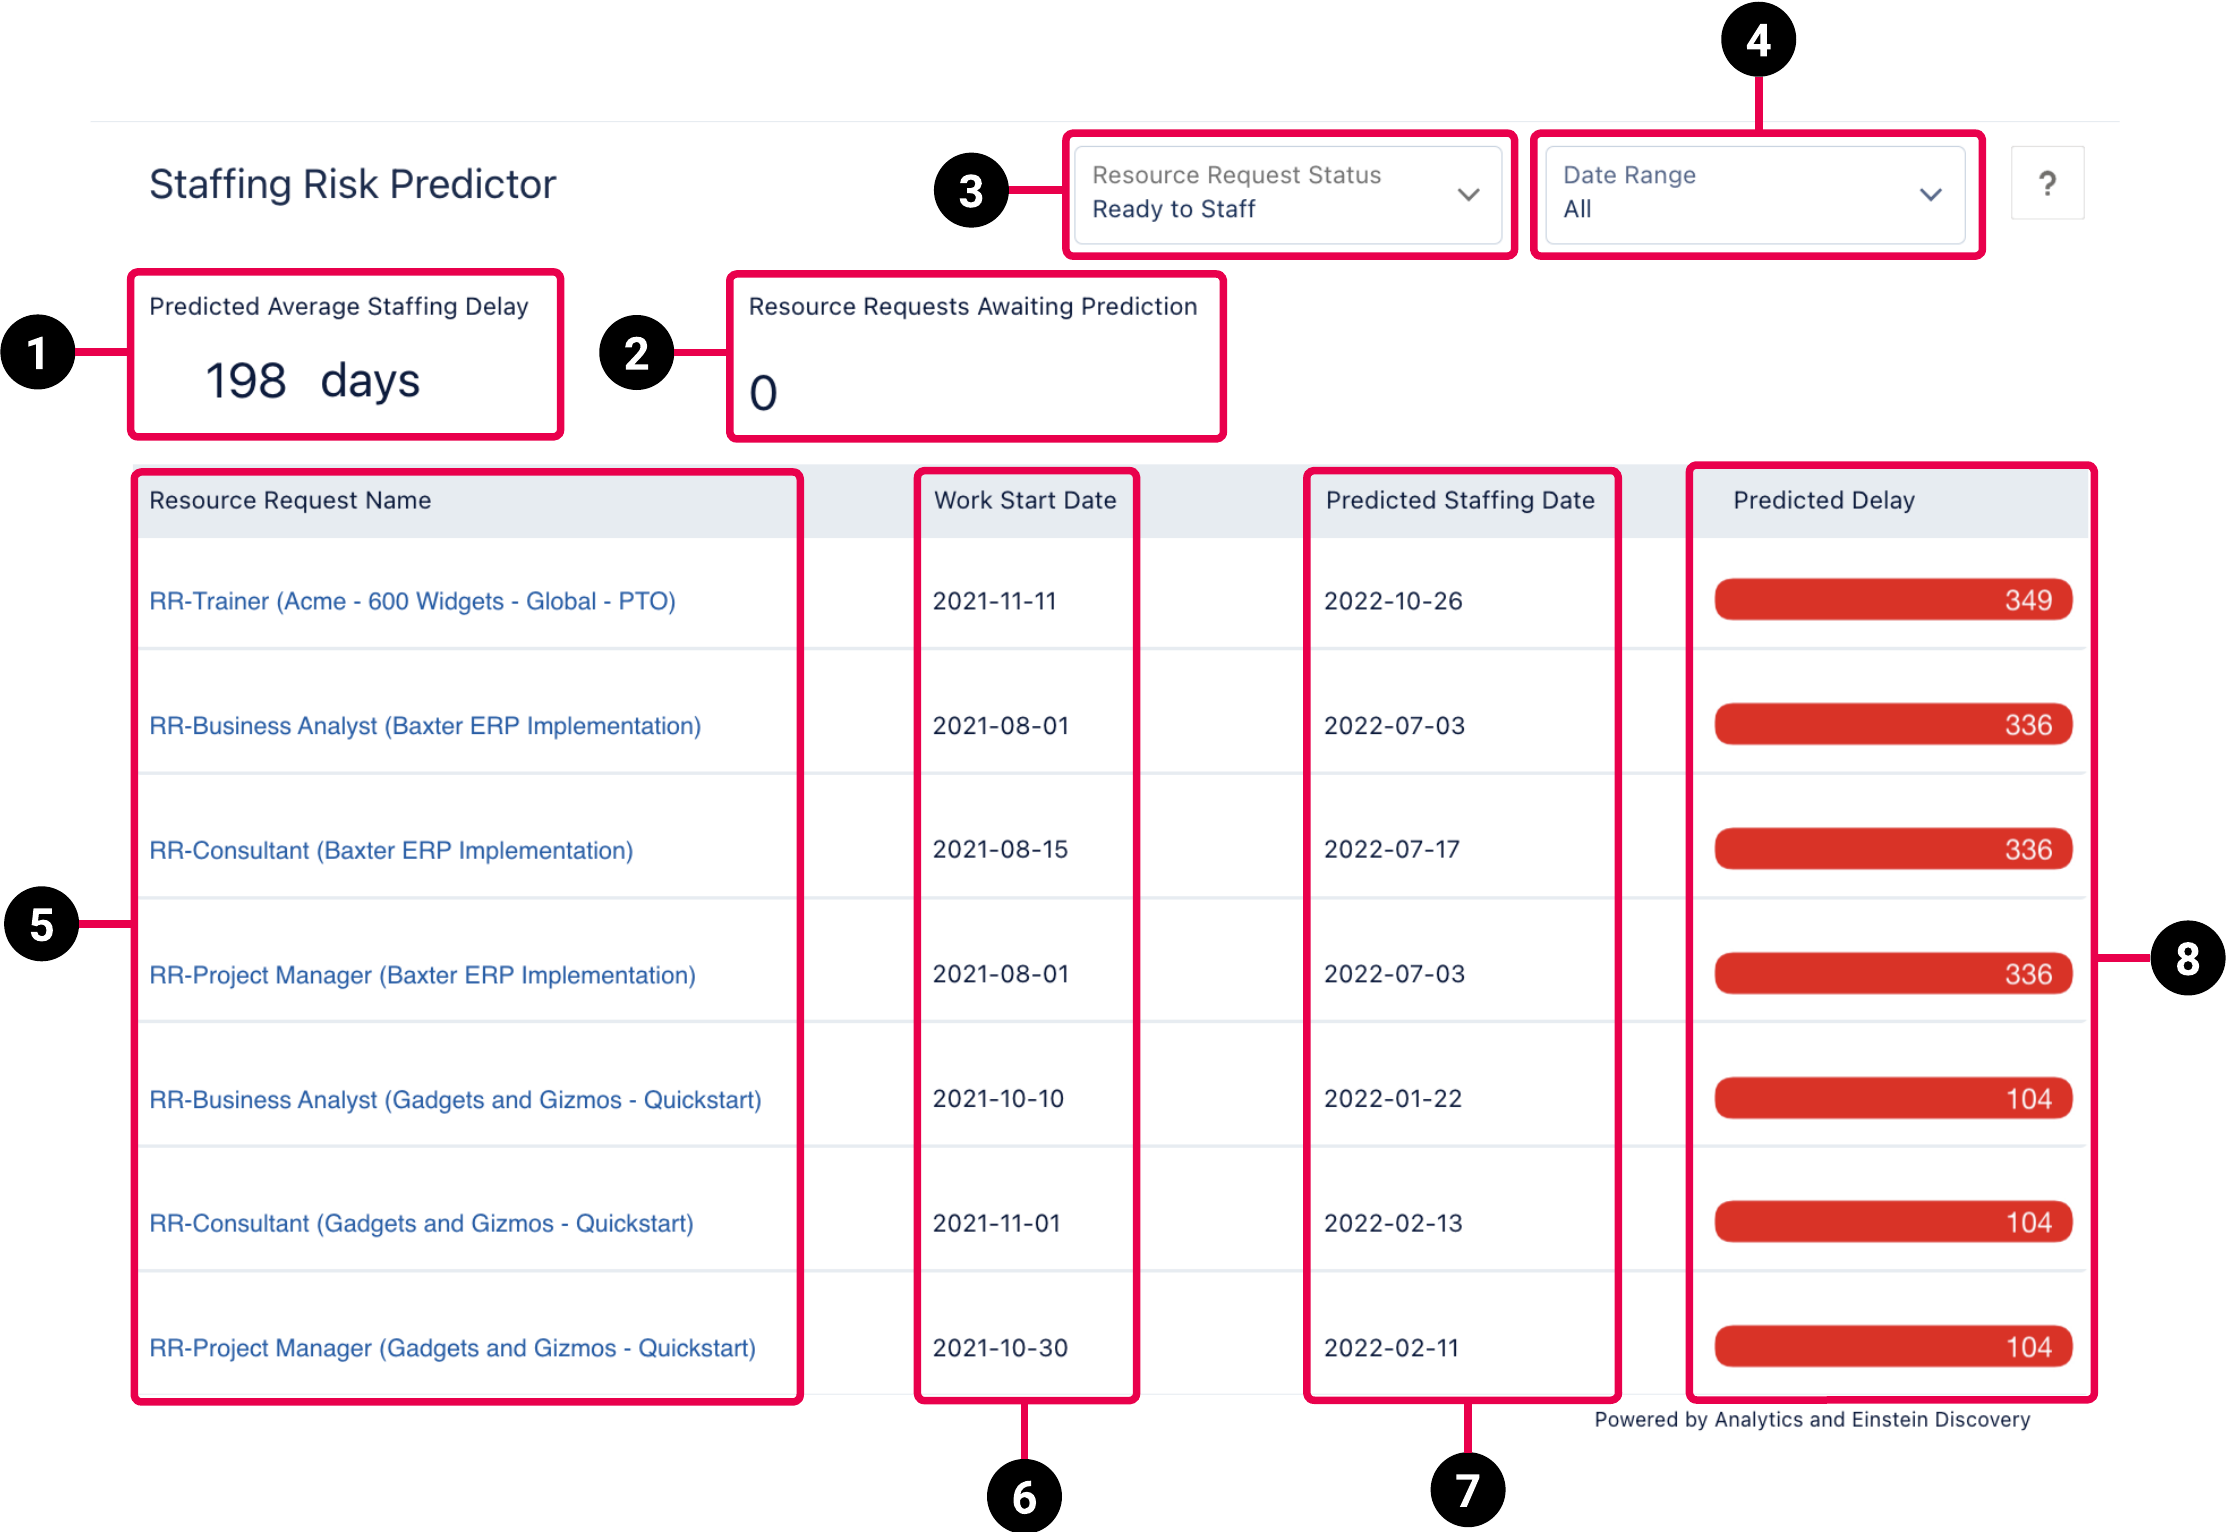
PSA Staffing Risk Predictor (beta) Dashboard
The PSA Staffing Risk Predictor (beta) dashboard provides visualization of the difference in days between the scheduled work start date of a resource request and the date on which it's predicted that the resource request will be staffed. Predictions are based on the Einstein Discovery model Days to Staff Predictor (beta).
The dashboard is designed to make project managers aware of any resource requests that are unlikely to be staffed before the date that work is scheduled to start. This prompts action to either prioritize the staffing of these resource requests or change the project plan to accommodate more realistic predicted lead times for staffing.
Datasets
Data displayed in the dashboard is derived from the Days to Staff dataset, which includes data from the Project Reporting dataset in PS Cloud Core Analytics. For more information on these datasets, see Project Reporting Dataset Output Fields.
PSA Staffing Risk Predictor (beta) Dashboard Guide
The PSA Staffing Risk Predictor (beta) dashboard has the following elements.

| Element Number | Name | Description | Additional Information |
|---|---|---|---|
| 1. |
Predicted Average Staffing Delay |
The average difference in days between the work start date and predicted staffing date. The resource requests included in this calculation are filtered by the status and date range specified in the Resource Request Status and Date Range pickers. |
Calculated as total Predicted Days Staff Variance for all filtered resource requests with predictions / total number of filtered resource requests with predictions. |
| 2. |
Resource Requests Awaiting Prediction |
The number of resource requests that are pending processing by the Days to Staff (beta) model because they were created since analytics was last run. The resource requests included in this value are filtered by the status specified in the Resource Request Status picker. To include resource requests that are awaiting predictions in this metric on embedded versions of the dashboard, you must run analytics after projects are created to add them to the dataset. |
Resource requests awaiting prediction cannot be filtered by date range. |
| 3. | Resource Request Status Picker |
Filters the dashboard to display only the resource requests that have the status selected in the picker. The Predicted Average Staffing Delay calculation and the Resource Requests Awaiting Prediction value are also filtered by the selected status. |
Default values:
|
| 4. | Date Range Picker |
Filters the dashboard to display only the resource requests with a Resource Request Start Date that falls within the specified date range. The Predicted Average Staffing Delay calculation is also filtered by the specified date range. Date Range options are as follows:
|
Resource requests awaiting prediction cannot be filtered by date range. |
| 5. |
Resource Request Name |
The name of the resource request. |
Maps to |
| 6. |
Work Start Date |
The scheduled work start date of the resource request. |
Maps to |
| 7. |
Predicted Staffing Date |
The date on which it's predicted that the resource request will be staffed. This value is determined by the Days to Staff Predictor (beta) model. |
Maps to |
| 8. |
Predicted Delay |
The variance in days between the work start date and the predicted staffing date. Positive values, where it is predicted that the resource request will be staffed after the work start date, are shown in red. Negative values, where it is predicted that the resource request will be staffed before the work start date, are shown in green. |
Calculated as the difference between Resource Request Start Date and Predicted Resource Request Staffing Date. |
Sorting the Data
You can sort the data displayed on the dashboard using the following values:
|
Value |
Description |
|---|---|
| Resource Request Name |
Sorts the data in ascending or descending alphabetical order. Maps to Resource Request Name. |
| Resource Request ID | Sorts the data in ascending or descending order numerical order. Maps to Resource Request Name. |
| Resource Request Start Date | Sorts the data in ascending or descending date order. Maps to Work Start Date. |
| Predicted Resource Request Staffing Date | Sorts the data in ascending or descending date order. Maps to Predicted Staffing Date. |
| Predicted Staffing Days Variance | Sorts the data in ascending or descending numerical order. Maps to Predicted Delay. |
 SECTIONS