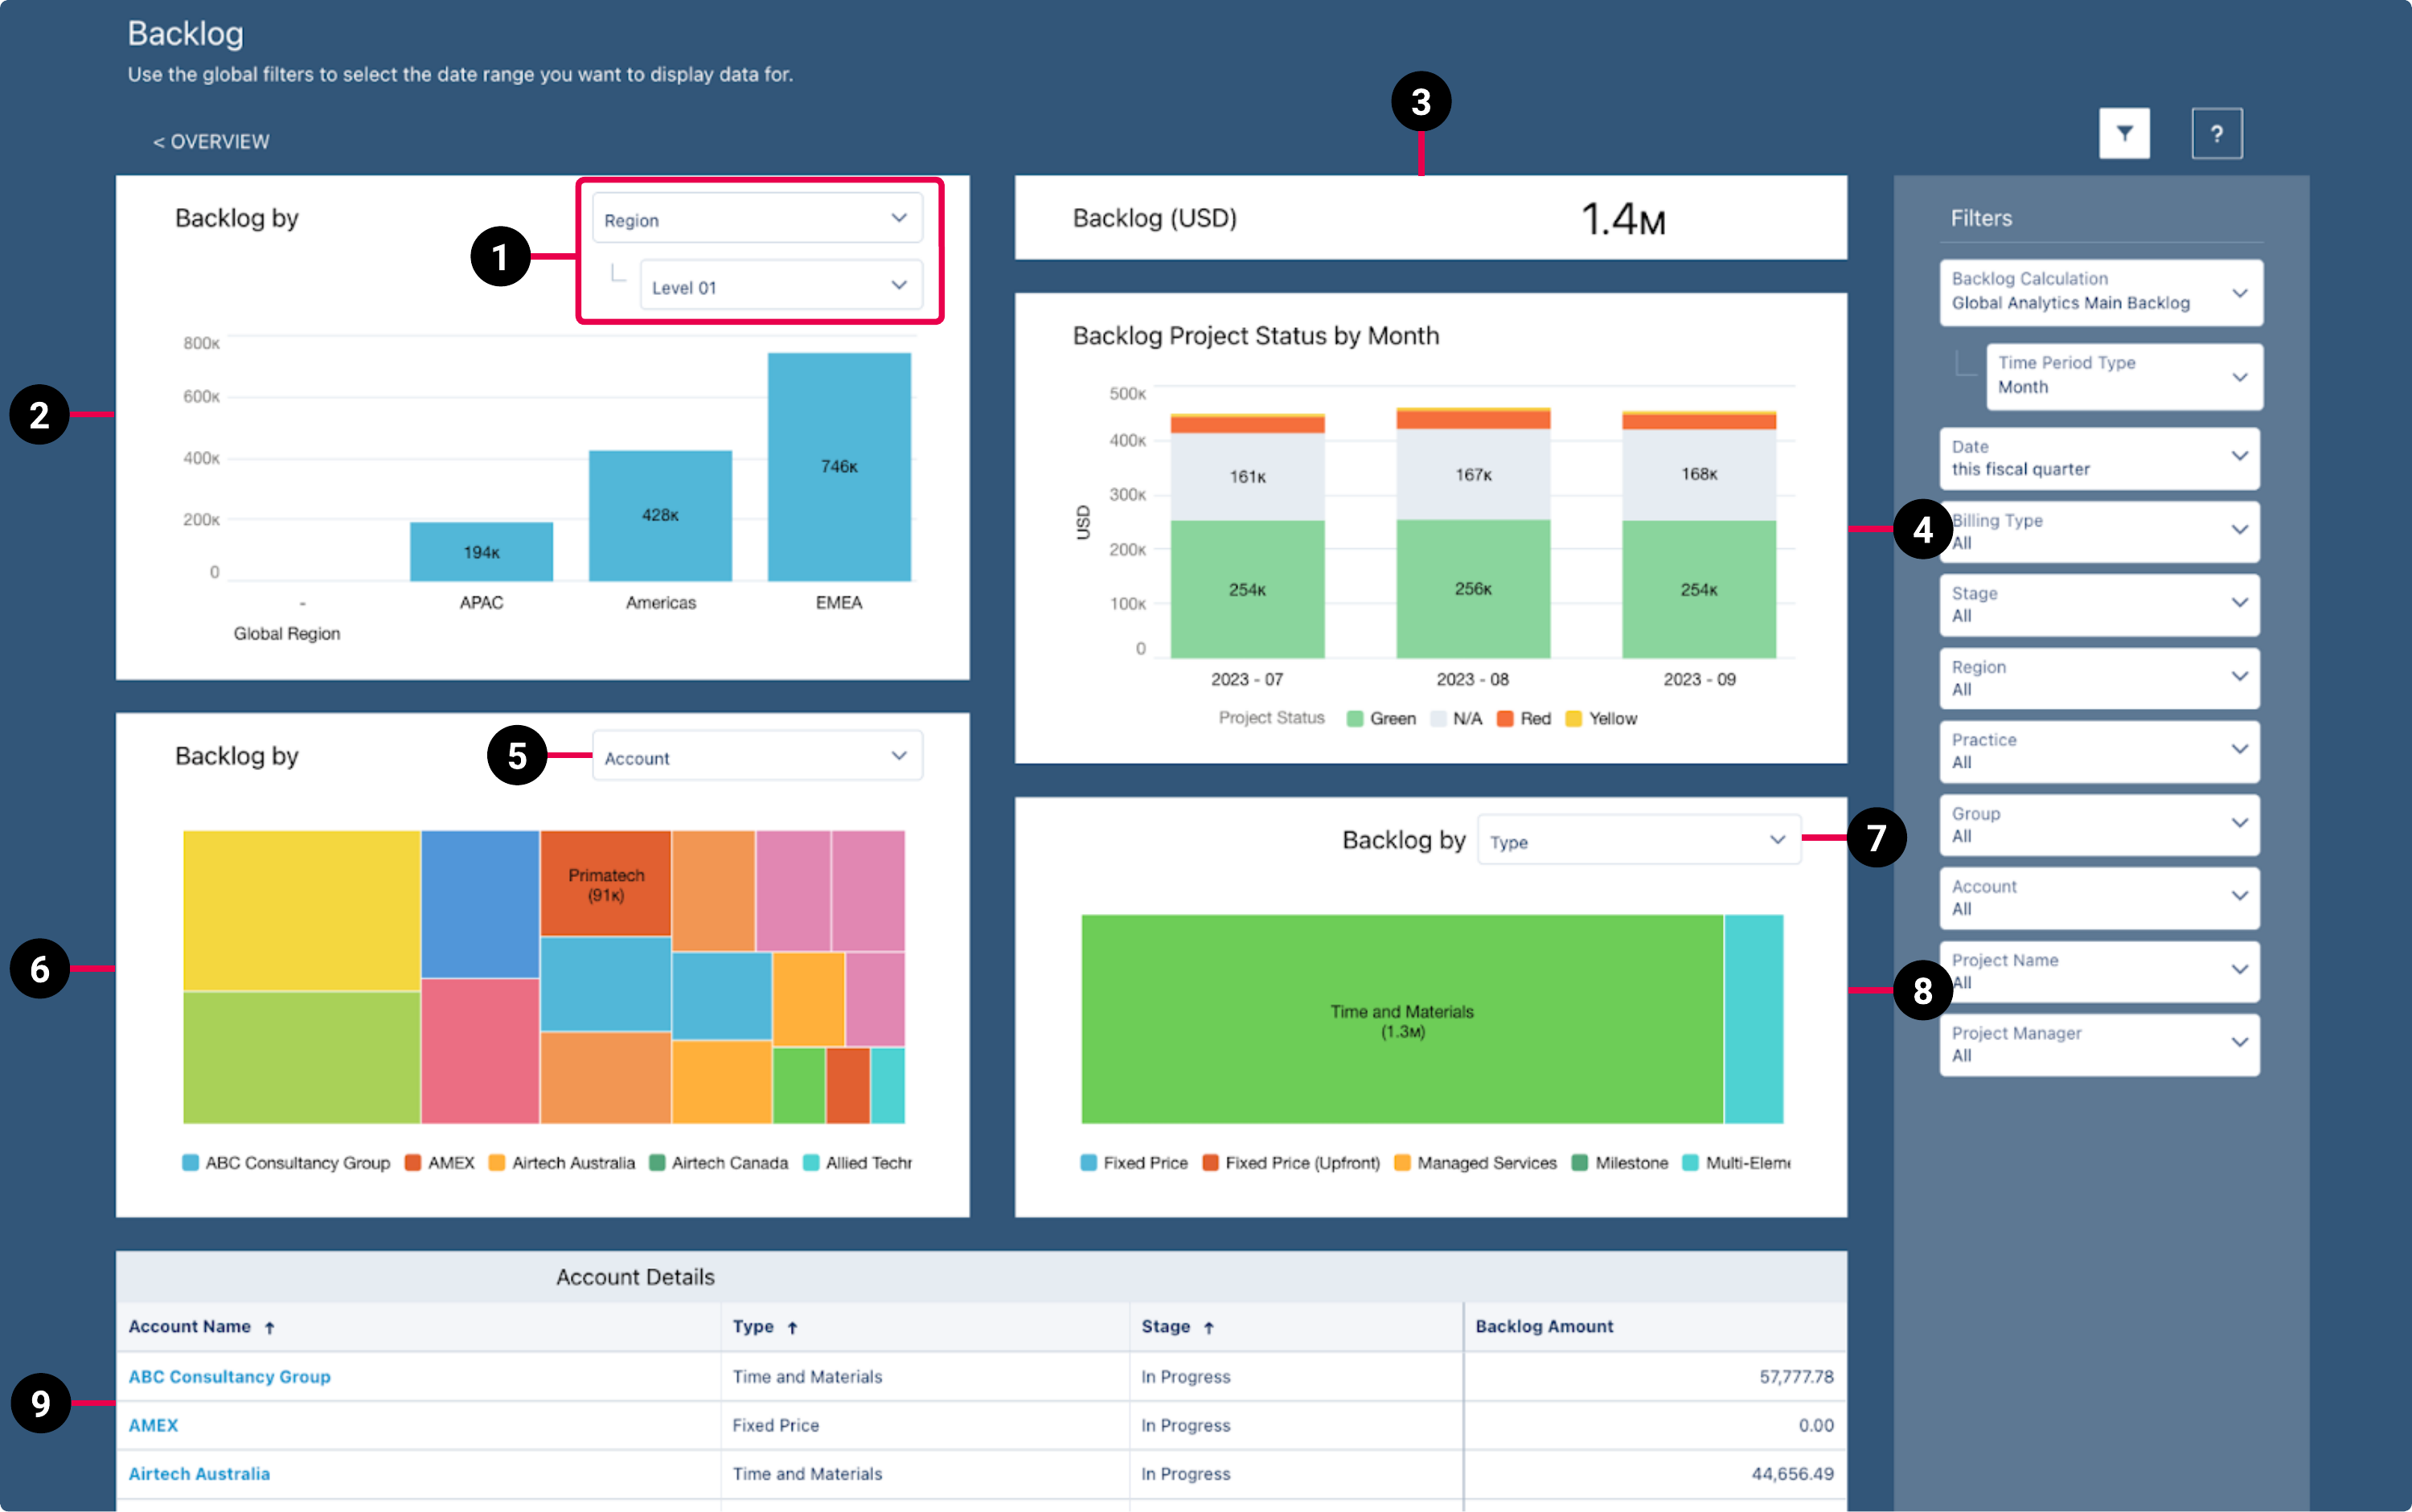
PSA Backlog Dashboard
The PSA Backlog dashboard enables you to:
- View key performance indicators (KPIs) for your backlog and your unscheduled backlog.
- View your backlog and unscheduled backlog data, including additional information, such as the project status, project bookings value, project billable hours, and unscheduled revenue.
This dashboard is created as part of the PS Cloud Advanced Analytics app and displays data from the Backlog dataset. For more details of the fields used by the PSA Backlog dashboard, see Backlog Dataset PS Cloud Analytics Output Fields.
PSA Backlog Dashboard Guide
By default, the PSA Backlog dashboard displays data for the current fiscal quarter and only includes scheduled backlog amounts.

|
Element Number |
Name |
Description |
Calculation |
Referenced Calculation |
Source Dataset |
|---|---|---|---|---|---|
| 1. | View By Picker for Backlog By RPG Bar Chart |
Defines the data displayed in the Backlog By RPG bar chart. |
Backlog Amount grouped by Project Region Level 00 and Region Level 01 (responds to selections), stacked by Backlog Type. |
Displays data by region. | Backlog Dataset PS Cloud Analytics Output Fields |
Backlog Amount grouped by Project Practice Level 00 and Practice Level 01 (responds to selections), stacked by Backlog Type.
|
Displays data by practice. | ||||
Backlog Amount grouped by Project Group Level 00 and Group Level 01 and stacked by Backlog Type.
Data displayed responds to selections. |
Displays data by group. | ||||
| 2. | Backlog By RPG Bar Chart | Displays the total backlog amount for the value selected in the view by picker (1). | Backlog Amount
filtered by Time Period Type = Week or Month, Has Project = Yes, and Time Period Start Date = This fiscal quarter. Data displayed responds to selections. |
None | |
| 3. | Backlog KPI | Total backlog amount. | Backlog Amount filtered by Time Period Type = Week or Month, Has Project = Yes, and Time Period Start Date = This fiscal quarter. Data displayed responds to selections.
|
None | |
| 4. | Backlog Time Period Stacked Chart | Displays the total backlog amount on project status by month. |
Backlog Amount grouped by Filtered by |
None | |
| 5. | View By Picker for Backlog By Account or Project Bar Chart |
Defines the data displayed in the Backlog By account or project bar chart. |
Account | Displays data by account. | |
| Project | Displays data by project. | ||||
| 6. | Backlog By Account or Project Bar Chart | Displays the total backlog amount for the value selected in the view by picker (5). | Backlog Amount grouped by Account Name or Project Name and filtered by Time Period Type = Week or Month, Has Project = Yes, and Time Period Start Date = This fiscal quarter. Data displayed responds to selections. |
None | |
| 7. | View By Picker for Backlog By Opportunity, Project Manager, Stage, or Type Bar Chart | Defines the data displayed in the Backlog By opportunity, project manager, stage, or type bar chart. | Opportunity | Displays data by opportunity. | |
| Project Manager | Displays data by project manager. | ||||
| Stage | Displays data by stage. | ||||
| Type | Displays data by type. | ||||
| 8. | Backlog By Opportunity, Project Manager, Stage, or Type Bar Chart | Displays the total backlog amount for the value selected in the view by picker (8). |
Backlog Amount grouped by |
None | |
| 9. | Account Details list | Details the backlogs amounts for all accounts. Data can be organized by account name, type, or stage. | Backlog Amount grouped by Account Name,
|
None |
 Managing Filters
Your filter selections determine the data displayed on the dashboard. To set or change your filters, use the following drop-down options:
- Backlog Calculation: select the backlog calculation you want to view data for. You can select multiple backlog calculations to visualize in the dashboard charts.
- Time Period Type: select the time period type you want to group the data by. Only the time period types available for the selected backlog calculation are displayed. For example, if you create and select a calculation that uses both weekly and monthly time period types, you can only select between those two time period types for this filter.
- Date: select the time period you want to view data for. You can select between fiscal year, fiscal quarter, calendar year, calendar quarter, calendar month, and day. You can also select all time or custom to input the time period of your choosing.
- Backlog Type: select the backlog type you want to view data for.
- Billing Type: select the billing type you want to view data for.
- Stage: select the stage of the project you want to view data for.
- Region: select the region, according to your PSA region, practice, and group settings, you want to view data for.
- Practice: select the practice, according to your PSA region, practice, and group settings, you want to view data for.
- Group: select the group, according to your PSA region, practice, and group settings, you want to view data for.
- Account: select the account whose related projects you want to view the data for. You can also select All to view data from all accounts.
- Project Name: select the project by name you want to view the data for. You can also select All to view data from all projects.
- Project Manager: select the project manager whose assigned projects you want to view the data for. You can also select All to view data from all projects.
For more information about dashboard functionality, see Using the Dashboards Charts.