PSA Project Burnup Plus Dashboard
The PSA Project Burnup Plus dashboard is the same as the PSA Project Burnup dashboard but, additionally, it enables you to:
- Use predictive analytics to view velocity trends in your projects.
- Track the burn-through date
 The burn-through date is represented in the Project Burnup dashboard as the point in time where the predicted billings surpass the assigned budget for the project, or when the predicted hours surpass the planned hours for the project. for your projects to see when you risk going over-budget or exhausting your allocated hours.
For more information on PSA Project Burnup dashboard, see PSA Project Burnup Dashboard .
This dashboard is created as part of the PS Cloud Advanced Analytics app.
PSA Project Burnup Plus Dashboard Guide
The PSA Project Burnup Plus dashboard has the following additional elements, which are available in both the Billings and Hours view.
| Element Number | Name | Description |
|---|---|---|
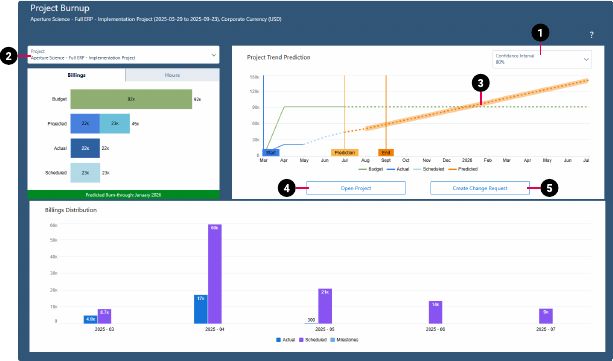
| 1. | Confidence Interval Picker | Enables you to set the degree of accuracy for the timeseries trend prediction. By default, the selector is set to display a confidence interval of 80 percent. For more information about timeseries functionality, see the Salesforce Help. |
| 2. | Project Picker | Enables you to select the project you want to display data for. |
| 3. | Prediction Line |
The line of best fit based on your current actuals data, using the algorithm used to predict future performance. The trend model line provides a means of reviewing the results generated by the algorithm against current performance, which is then applied to future, forecasted periods. |
| 4. | Open Project | Opens the PSA record for the selected project. Use this button to drill down to the record of the project displayed by the dashboard. |
| 5. | Create Change Request | Opens the change request page for the selected project. Use this feature when you need to request additional budget for a project, or to make a change to the project that is outside to the scope of work that was originally agreed upon. For more information about change requests, see the PSA Help. |