SECTIONS
PSA Skills Capacity and Demand Planning Dashboard
The PSA Skills Capacity and Demand Planning dashboard enables you to determine:
- If you have the right resources to deliver your project, based on their skill sets
- If your resources have the necessary skills to meet demand
- The number of your resources that have a particular skill set, and the availability of those resources
- If you can fulfill demand with internal resources only, or if you also require resources
- Where you should invest in longer-term development and growth, based on reporting trends
We recommend you embed the dashboard in the Resource Management Workspace. For more information, see Embedding the PSA Skills Capacity and Demand Planning Dashboard.
The dashboard is created as part of the PS Cloud Advanced Analytics app.
Prerequisites
In order to display a skill in the PSA Skills Capacity and Demand Planning dashboard, you must have at least one resource with a skill / certification rating of zero or higher in your PSA data environment for this skill. For more information, see
PSA Skills Capacity and Demand Planning Dashboard
The PSA Skills Capacity and Demand Planning dashboard contains the following pages, charts, tables, local filters and components:

The dashboard displays data from the Project Reporting, Resource Skills, and Utilization Results datasets. For more information about the fields used in the dashboard calculations, see the source dataset for the dashboard element in the PSA Skills Capacity and Demand Planning Dashboard Elements table.
|
Element Number |
Name |
Description |
Calculation |
Referenced Calculation |
Source Dataset |
|---|---|---|---|---|---|
|
Question picker for:
|
Based on the selection of the question from the picker, Data will be updated on section 3 and 4 of the dashboard.
Default Selection: Which skills have the least % availability? (Top 5) |
Project Reporting Dataset Output Fields, Resource Skills Dataset PS Cloud Analytics Output Fields, and Utilization Results Dataset PS Cloud Analytics Output Fields (filtered by object type= ‘Resource Requests’) |
|||
|
Demand Modeling |
Apply hours weighting by opportunity probability % to your unheld demand hours by selecting from filters. |
||||
|
Assigned |
Applies this formula to Hours Used part of Capacity Remaining: calculation: |
Utilization Results Dataset PS Cloud Analytics Output Fields
|
|||
|
Assigned + Held |
Applies this formula to Hours Used part of Capacity Remaining calculation:
|
||||
|
Assigned + Held + Unheld |
Applies this formula to Hours Used part of Capacity Remaining calculation:
OR |
*Unheld resource request hours may be weighted and/or limited by the Opportunity Weighting and Opportunity Threshold selections. For more information, See section ‘Opportunity Weighting’ |
|||
|
Opportunity Threshold (%) Filters out any hours on resource requests for unheld hours, where the opportunity probability percentage is below the lower limit of the selected range. For example, if you select 40+, then only unheld hours where the associated opportunity probability percentage on the resource request is greater than 40% are included. The available range is 0-100%. |
Applies a filter by
OR |
||||
| Opportunity Weighting (Yes/No) Applies the probability percentage of the associated opportunity as a weighting to unheld hours on resource requests. |
Swaps in OR To the Hours Used formula |
See Hours Used definition in Hours Included section above |
|||
|
Bar chart: |
Displays a bar chart indicating the distribution of capacity by skill or certification as a percentage value. |
Which skills have the least % availability? (Top 5) |
Skill, Capacity Remaining (%) =1- (sum( Hours Used: see ‘Hours Included’ section above. Ordered by lowest capacity remaining, limit=5 |
Project Reporting Dataset Output Fields and Utilization Results Dataset PS Cloud Analytics Output Fields |
|
|
Which skills are in the highest demand? (Top 5) |
Skill, Hours Used Hours Used: see ‘Hours Included’ section above Ordered by highest hours used, limit = 5 |
||||
|
Show all skills capacity |
Skill, Capacity Remaining (%) =1- (sum( Hours Used: see ‘Hours Included’ section above |
||||
|
Line chart: |
Displays a line chart indicating the movement of capacity by skill or certification as a percentage value over time. You can filter the data displayed in the bar and line chart with the following drop-down selectors. To edit these questions, see Configuring Dashboard Questions. Which skills have the least % availability? (Top 5) This selector Which skills are in the highest demand? (Top 5). Show all skills capacity. |
Which skills have the least % availability? (Top 5). This selector filters the top five skills with the lowest overall value of remaining capacity for your selected date range. |
Capacity Remaining (%) =1- (sum( Hours Used: see ‘Hours Included’ section above. |
Utilization Results Dataset PS Cloud Analytics Output Fields |
|
|
Which skills are in the highest demand? (Top 5) This selector filters the top five skills with the highest value of requested overall hours. |
see ‘Hours Included’ section above. |
Project Reporting Dataset Output Fields and Utilization Results Dataset PS Cloud Analytics Output Fields |
|||
|
Show all skills capacity This selector displays the remaining capacity for all skills. |
Capacity Remaining (%) 1-(sum( Hours Used: see ‘Hours Included’ section above |
||||
|
View by picker |
Based on the selection from the picker, Data will be re-grouped on section 7 of the dashboard. |
Skill |
|
||
|
Skill + Resource |
|
||||
|
Skill + Role |
Or Role from Project Reporting where Object type = |
Project Reporting Dataset Output Fields, Resource Skills Dataset PS Cloud Analytics Output Fields, and Utilization Results Dataset PS Cloud Analytics Output Fields |
|||
|
Time grouping |
Based on the selection from the picker for the date display type, Data will be re-grouped on 7 of the dashboard. |
Day |
|
Utilization Results Dataset PS Cloud Analytics Output Fields |
|
|
|
TimePeriodWeek |
||||
|
Time Period (Month) |
|
||||
|
Heat map of skills remaining capacity |
Displays a heatmap indicating the distribution of capacity by skill or certification. This chart is faceted by the bar and line charts displayed above it. (Item 5)You can filter the data displayed in this chart with the following drop-down selectors: SkillSkill + ResourceRole + Skill(Item 6) You can also apply the following time groupings to the data displayed in the heat map chart: Time Period Week Time Period Month Day. |
Please refer to 8 (Tooltip) for details. |
Please refer to8 (Tooltip) for details. |
Project Reporting Dataset Output Fields and Utilization Results Dataset PS Cloud Analytics Output Fields |
|
|
Tooltip |
You can view values for the Remaining FTE and Total FTE on the tooltip for the heatmap chart. These tooltip values are obtained for each resource, and then calculated based on the heatmap's chosen groupings using the following calculations: |
Remaining FTE (By Day) |
|
Utilization Results Dataset PS Cloud Analytics Output Fields |
|
| Total FTE (By Day) |
|
||||
| Hours Remaining (By Day) |
|
||||
| Hours Used for Assigned (By Day) |
|
||||
| Hours Used for Held (By Day) |
|
||||
| Unheld hours (when Opportunity Weighting is selected) (By Day) |
|
||||
| Unheld hours (when Opportunity Weighting is not selected) By Day |
|
||||
| Total FTE (By week) |
|
Utilization Results Dataset PS Cloud Analytics Output Fields |
|||
| Remaining FTE (By week) |
|
||||
| Total FTE (By month) |
|
||||
| Remaining FTE (By month) |
|
||||
|
Resource Availability Table |
Displays a table indicating the availability of resources. This table is faceted by the heatmap chart and comprises the following columns, You can drill cells in this column to view details of resources in your PSA app. |
Resource Name |
|
||
|
Resource Role |
|
||||
|
|
PracticeName |
||||
|
Resource Skills |
|
||||
|
Remaining Hours |
Calculated as Calendar Hours minus the sum of all the other hours columns displayed in this table. |
||||
|
Billable Assignment Hours |
|
||||
|
Credited Assignment Hours |
|
||||
|
Non-Billable Assignment Hours |
|
||||
|
Held Hours |
|||||
|
Calendar Hours |
|
||||
|
Time Excluded Assignment Hours |
|
||||
|
Utilization Excluded Assignment Hours |
|
Full Time Equivalent (FTE)
You can view values for the Remaining FTE and Total FTE on the tooltip for the heatmap chart. These tooltip values are obtained for each resource, and then calculated based on the heatmap's chosen groupings using the following calculations:
|
Tooltip |
Time Period |
Dashboard Calculation |
Dataset |
|---|---|---|---|
| Remaining FTE | By day | Hours Remaining / (ValueStandardWorkCalendarHours * Unique Days) | Utilization Results |
| Total FTE | By day | Calendar Hours / ValueStandardWorkCalendarHours | Utilization Results |
| Hours Remaining | By day | Calendar Hours - Hours Used | Utilization Results |
| Hours Used for Assigned | By day | ValueBillableAssignmentHours + ValueCreditedAssignmentHours + ValueNonBillableAssignmentHours + ValueTimeExcludedAssignmentHours + ValueUtilizationExcludedAssignmentHours | Utilization Results |
| Hours Used for Held | By day | ValueHeldResourceRequestHours + ValueUtilizationExcludedHeldRRHours | Utilization Results |
| Unheld hours (when Opportunity Weighting is selected) | By day | ValueResourceRequestSOWHours | Project Reporting |
| Unheld hours (when Opportunity Weighting is not selected) | By day | ValueResourceRequestWeightedSOWHours | Project Reporting |
| Total FTE | By week |
Calendar Hours / (ValueStandardWorkCalendarHours * Unique Days)
|
Utilization Results |
| Remaining FTE | By week | Hours Remaining / (ValueStandardWorkCalendarHours * Unique Days) | Utilization Results |
| Total FTE | By month | Calendar Hours / (ValueStandardWorkCalendarHours * Unique Days) | Utilization Results |
| Remaining FTE | By month | Hours Remaining / (ValueStandardWorkCalendarHours * Unique Days) | Utilization Results |
Filters
The following filters are available on the PSA Skills Capacity and Demand Planning dashboard. For more information about the dataset fields that provide the values for some of the dashboard filters, see Project Reporting Dataset Output Fields, Resource Skills Dataset PS Cloud Analytics Output Fields, and Utilization Results Dataset PS Cloud Analytics Output Fields.
|
Name |
Description |
Source of Filter Options |
|---|---|---|
|
Date Range |
Select a specific time period to filter by, or select "Custom" to create your own time period to filter by. |
Filtered by the Project Time Period End Date field in the Project Reporting dataset, but the value from the Project Time Period Name field is displayed in the picklist. |
|
Group |
Select the specific groups to filter by, and apply the relevant operators to include or exclude them from the displayed data. | Dataset field: Resource Group Name |
|
Group Level |
Select the specific group levels to filter by. Selections determine the options displayed in the Group filter. | Dataset field: Resource Group Level XX, where XX represents a number between 00 and 12. |
|
Practice |
Select the specific groups to filter by, and apply the relevant operators to include or exclude them from the displayed data. | Dataset field: Resource Practice Name |
|
Practice Level |
Select the specific practice levels to filter by. Selections determine the options displayed in the Practice filter. | Dataset field: Resource Practice Level XX, where XX represents a number between 00 and 12. |
|
Region |
Select the specific groups to filter by, and apply the relevant operators to include or exclude them from the displayed data. | Dataset field: Resource Region Name |
|
Region Level |
Select the specific region levels to filter by. Selections determine the options displayed in the Region filter. | Dataset field: Resource Region Level, where XX represents a number between 00 and 12. |
| Resource | Select the specific resources to filter by. | Dataset field: Resource Name |
| Role | Select the specific resource roles to filter by. | Dataset field: Resource Role |
| Skill Rating | Select the specific skill ratings to filter by. | Dataset field: Rating |
| Skill Set | Select the specific skill sets to filter by. | Dataset field: Skill Set Name |
| Skill Type | Select the specific skill types to filter by. | Dataset field: Skill / Certification Type |
For more information about dashboard functionality, see Using the Dashboards Charts.
Configuring Dashboard Questions
You can edit the default questions displayed in the bar and line chart drop-down selectors. For example, you might want to change the wording of a question, or the data displayed in response to a question.
To do this, perform the following steps.
- In Analytics Studio, navigate to the app containing the PSA Skills Capacity and Demand Planning dashboard you want to edit.
- Click Edit to enter edit mode.
- Double-click the question component above the bar and line charts.
- Click Continue.
- In the Questions modal that opens, amend your required questions. Available options include:
- Text display. Edit this cell to amend the wording of a question. This does not alter the data displayed by the question.
- Number limit. Edit this cell to amend the number of bars displayed in the bar chart.
- Text order. Use the asc or desc value in this cell to control whether values are displayed in ascending or descending order in the dashboard.
- We recommend that you do not change the Text measure or Text order cells. Altering the values in these cells might prevent data from displaying correctly in your dashboard.
- Click Done.
Viewing Capacity for Multiple Skills
We recommend that you use this dashboard to examine demand for single skills, and how many hours you have for resources with that skill.
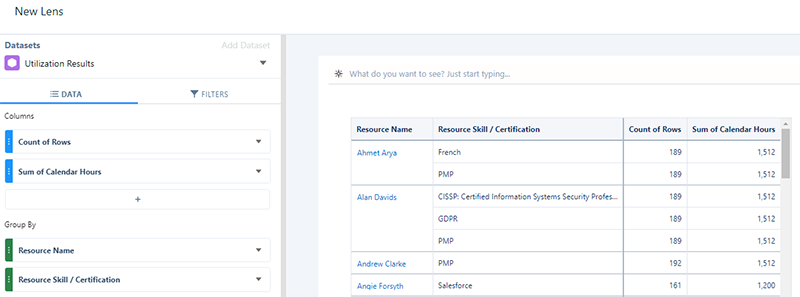
Calendar, assigned, and held hours are repeated for each resource skill or certification related to a resource.
For example, you might have a scenario in which you want to run two different projects requiring two different skills for a particular month. You might have a resource with the required availability in hours for two different skills. But the dashboard would not indicate that this resource would be unable to commit the same amount of hours simultaneously for two different projects, using their two different skills. In this case, we recommend that you use the view by Skill + Resource grouping in the dashboard to indicate where resources are listed under multiple skills.
We recommend that if you have two projects running at the same time that require two or more different skills, and the dashboard displays availability for both skills, that you check that you do not commit the same resource twice for their skills.
This repetition occurs when grouping by Resource Skill / Certification using data derived from Project Reporting and Utilization Results datasets. For example, see the grouping shown in the lens derived from the Utilization Results dataset below.