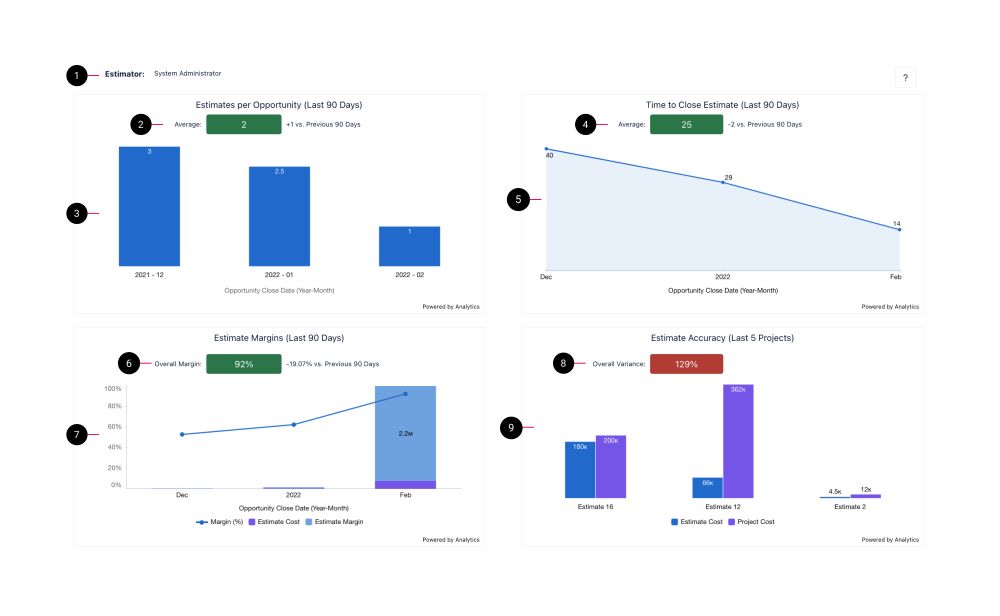
PSA Services CPQ Estimator Dashboard
The PSA Services CPQ Estimator dashboard enables you to view the performance of your estimation process over time using data derived from the Project Reporting dataset. This dashboard is designed to be embedded in the Services Estimation workspace.
This dashboard is created as part of the PS Cloud Core Analytics app.
PSA Services CPQ Estimator Dashboard Guide

Estimator Dashboard Elements
| 1 |
Estimator dashboard subtitle
|
Displays the name of the current dashboard user as the estimate owner. |
Filter Project Reporting dataset:
ProjectEstimateOwnerId
= s_user_data
s_user_data= SELECT Name, Id FROM User WHERE Id = '!{User.Id}’ |
|
Project Reporting
|
| 2 |
Average (Estimates per Opportunity (Last 90 Days))
|
The threshold indicator pill displays the overall average number of estimates per opportunity by month for opportunities with the status "Closed Won" in the last 90 days. It displays in red if the number of estimates per opportunity exceeds 3.1.
|
Count of Estimates / Count of Unique Opportunities
(lens formula)
Filter:
Last 90 days by opportunity close date
and
Opportunity status= closed-won
|
|
|
| 3 |
Estimates per Opportunity (Last 90 Days) bar chart
|
Displays the average number of estimates per opportunity by month for opportunities with the status "Closed Won" in the last 90 days. |
Count of Estimates / Count of unique Opportunities (lens formula) Filter:
Last 90 days by opportunity close date
Not filtered by:
Opportunity status= closed-won
Group: Estimate Owner Name
|
|
|
| 4 |
Average (Time to Close Estimate(Last 90 Days))
|
The threshold indicator pill displaysthe overall average time taken in days to close estimates over the past 90 days, in comparison with the preceding 90 days before that. It displays in red if the time to close is more than 35 days. |
Average(Estimate Time to Close)
filtered by last 90 days |
|
|
| 5 |
Time to Close Estimate (Last 90 Days) line graph
|
Displays the average time taken in days to close estimates over the past 90 days, in comparison with the preceding 90 days before that. By default, the threshold indicator pill displays in red if the time to close is more than 35 days.
|
Average(Estimate Time to Close)
Referenced Field: Estimate Time to Close
|
|
| 6 |
Overall Margin |
Displays the variance between the last 90 days and the preceding 90 days before that. By default, the threshold indicator pill displays in red if the variance is less than 45 percent.
|
(Estimate Net Amount - Estimate Cost) / Estimate Net Amount |
|
| 7 |
Estimate Margin (Last 90 Days) line graph
|
Displays the following for a given period of time:
|
Margin percent = (sum(ValueEstimateNetAmount) - sum(ValueEstimateCost)) / sum(ValueEstimateNetAmount)
|
|
| 8 |
Overall Variance
(Estimate Accuracy (Last 5 Projects))
|
Displays the overall variance between the last five projects and the estimates from which they were derived, using a comparison between the sum of the estimate cost and the sum of total project costs.
|
(Sum(Project Total Costs - Estimate Cost)) / (Sum(Estimate Cost))
|
|
| 9 |
Estimate Accuracy (Last 5 projects) bar chart
|
Displays the variance between the last five projects and the estimates from which they were derived, using a comparison between the sum of the estimate cost and the sum of total project costs. By default, the threshold indicator pill displays in red if the variance is above 15 percent.
|
(Project Total Costs - Estimate Cost) /Estimate Cost
|
|
|
Suggested Use Cases
Data displayed in this dashboard can help you perform the following tasks:
- Understand the efficiency of your estimation process by viewing how long it takes to win contracts based on your individual estimates. You can view how long it takes you to win contracts based on your estimates, and how many estimates you create per opportunity.
- Review your performance against your organization's estimation targets.
- Match your estimate data against project data.
Dashboard Calculations
The following calculations are used to display values in the PSA Services CPQ Estimatorand PSA Services CPQ Estimate Manager dashboards.
Overall Margin Values
(Estimate Net Amount - Estimate Cost) / Estimate Net Amount
Time to Close
The maximum difference between an estimate's creation date and the opportunity close date, using the oldest estimate created before the close date.
Estimates per Opportunity
The number of estimates created per opportunity.
The PSA Services CPQ Estimator dashboard contains the following pages, tables, local filters and components:
Configuring PSA Services CPQ Estimator Dashboard Elements
You can edit the default threshold values provided for the dashboard charts and the time range displayed in the Estimate Margins (Last 90 Days) chart. For more information, see Configuring the Services CPQ Estimate Dashboards.

 SECTIONS