 SECTIONS
PSA Project Billings Dashboard
The PSA Project Billings dashboard enables you to:
- View the total value available to bill for your project. This is a sum of timecards, milestones, expenses, and miscellaneous adjustments that are billable but have not yet been billed to the customer.
- View an aging summary of the value available to bill for business records that ended up to 30, 60, 90, 120, 120+ days ago.
- View a detailed breakdown of business records that are billable but have not yet been billed to the customer.
The dashboard is created as part of the PS Cloud Core Analytics app and displays data from the Project Reporting dataset. For more details of the fields used by the dashboard, see Project Reporting Dataset Output Fields.
We recommend you embed the dashboard on a new tab of your project Lightning page. For instructions on how to do this, see Adding the PSA Project Billings Dashboard to the Project Lightning Page.
PSA Project Billings Dashboard Guide
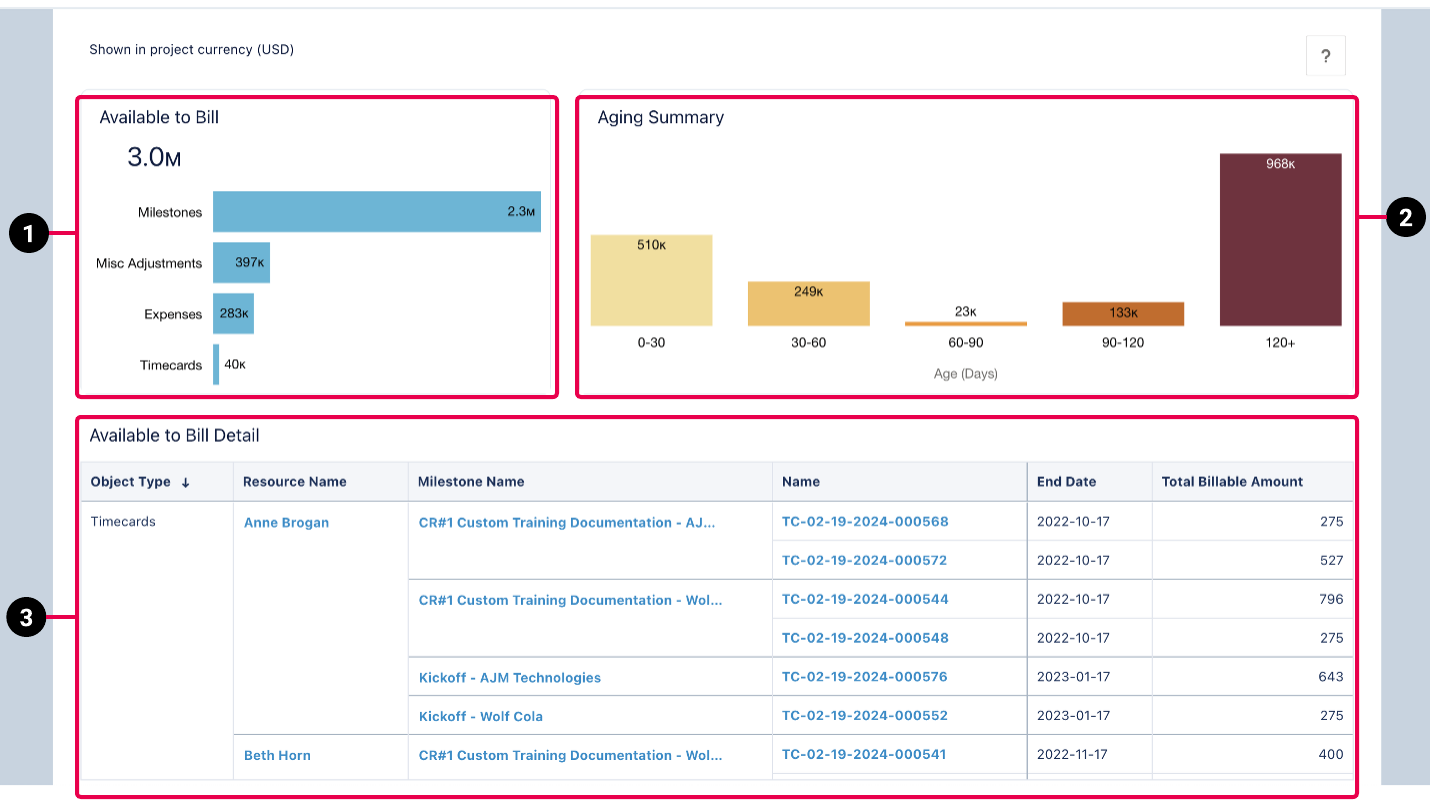
The dashboard contains the following elements. All values are shown in project currency when the dashboard is embedded on the Project Lightning Page.
| Element Number | Name | Description | Calculation |
|---|---|---|---|
| 1 | Available to Bill Bar Chart |
Displays the total amount available to bill for timecards, milestones, expenses, and miscellaneous adjustments in your project. You can facet the data displayed in the dashboard by clicking on |
This value is a sum of A business record is only included in this data if its |
| 2 | Aging Summary Bar Chart |
Displays the values available to bill for business records that ended up to 30, 60, 90, 120, 120+ days ago.
|
Each bar shows the sum of the Aging starts from the following dates for the different types of business record:
A business record is only included in this data if its |
| 3 | Available to Bill Detail |
Provides a detailed view of the individual business records that are available to bill. Drillable cells are highlighted in bold blue text. |
End Date is derived from the following dates for the different types of business record:
A business record is only included in this data if its |