PSA Utilization Analytics Capacity and Demand Planning Dashboard
The PSA Utilization Analytics Capacity and Demand Planning enables you to:
- View demand and capacity by Role, Region, Practice or Group.
- View a breakdown of capacity for your selected date range by Assigned, Held Requests, Unheld Requests and Available Capacity.
- View resources and their capacity hours for your selected date range and role.
- Drill through to view details of resources in PSA.
You can configure the dashboard to choose whether to include historical scheduling data in the dashboard's heat map and Resource Availability list. For more information, see Using the PSA Utilization Analytics Capacity and Demand Planning Dashboard Configuration Page.
We recommend you embed the dashboard in the Resource Management Workspace. For more information, see Embedding the PSA Utilization Analytics Capacity and Demand Planning Dashboard.
The dashboard is created as part of the PS Cloud Advanced Analytics app.
Prerequisites
To enable demand modeling, you must specify the threshold values in ascending order in your PSA utilization setup record. For more information, see Utilization Setup Fields.
PSA Utilization Analytics Capacity and Demand Planning Dashboard Guide
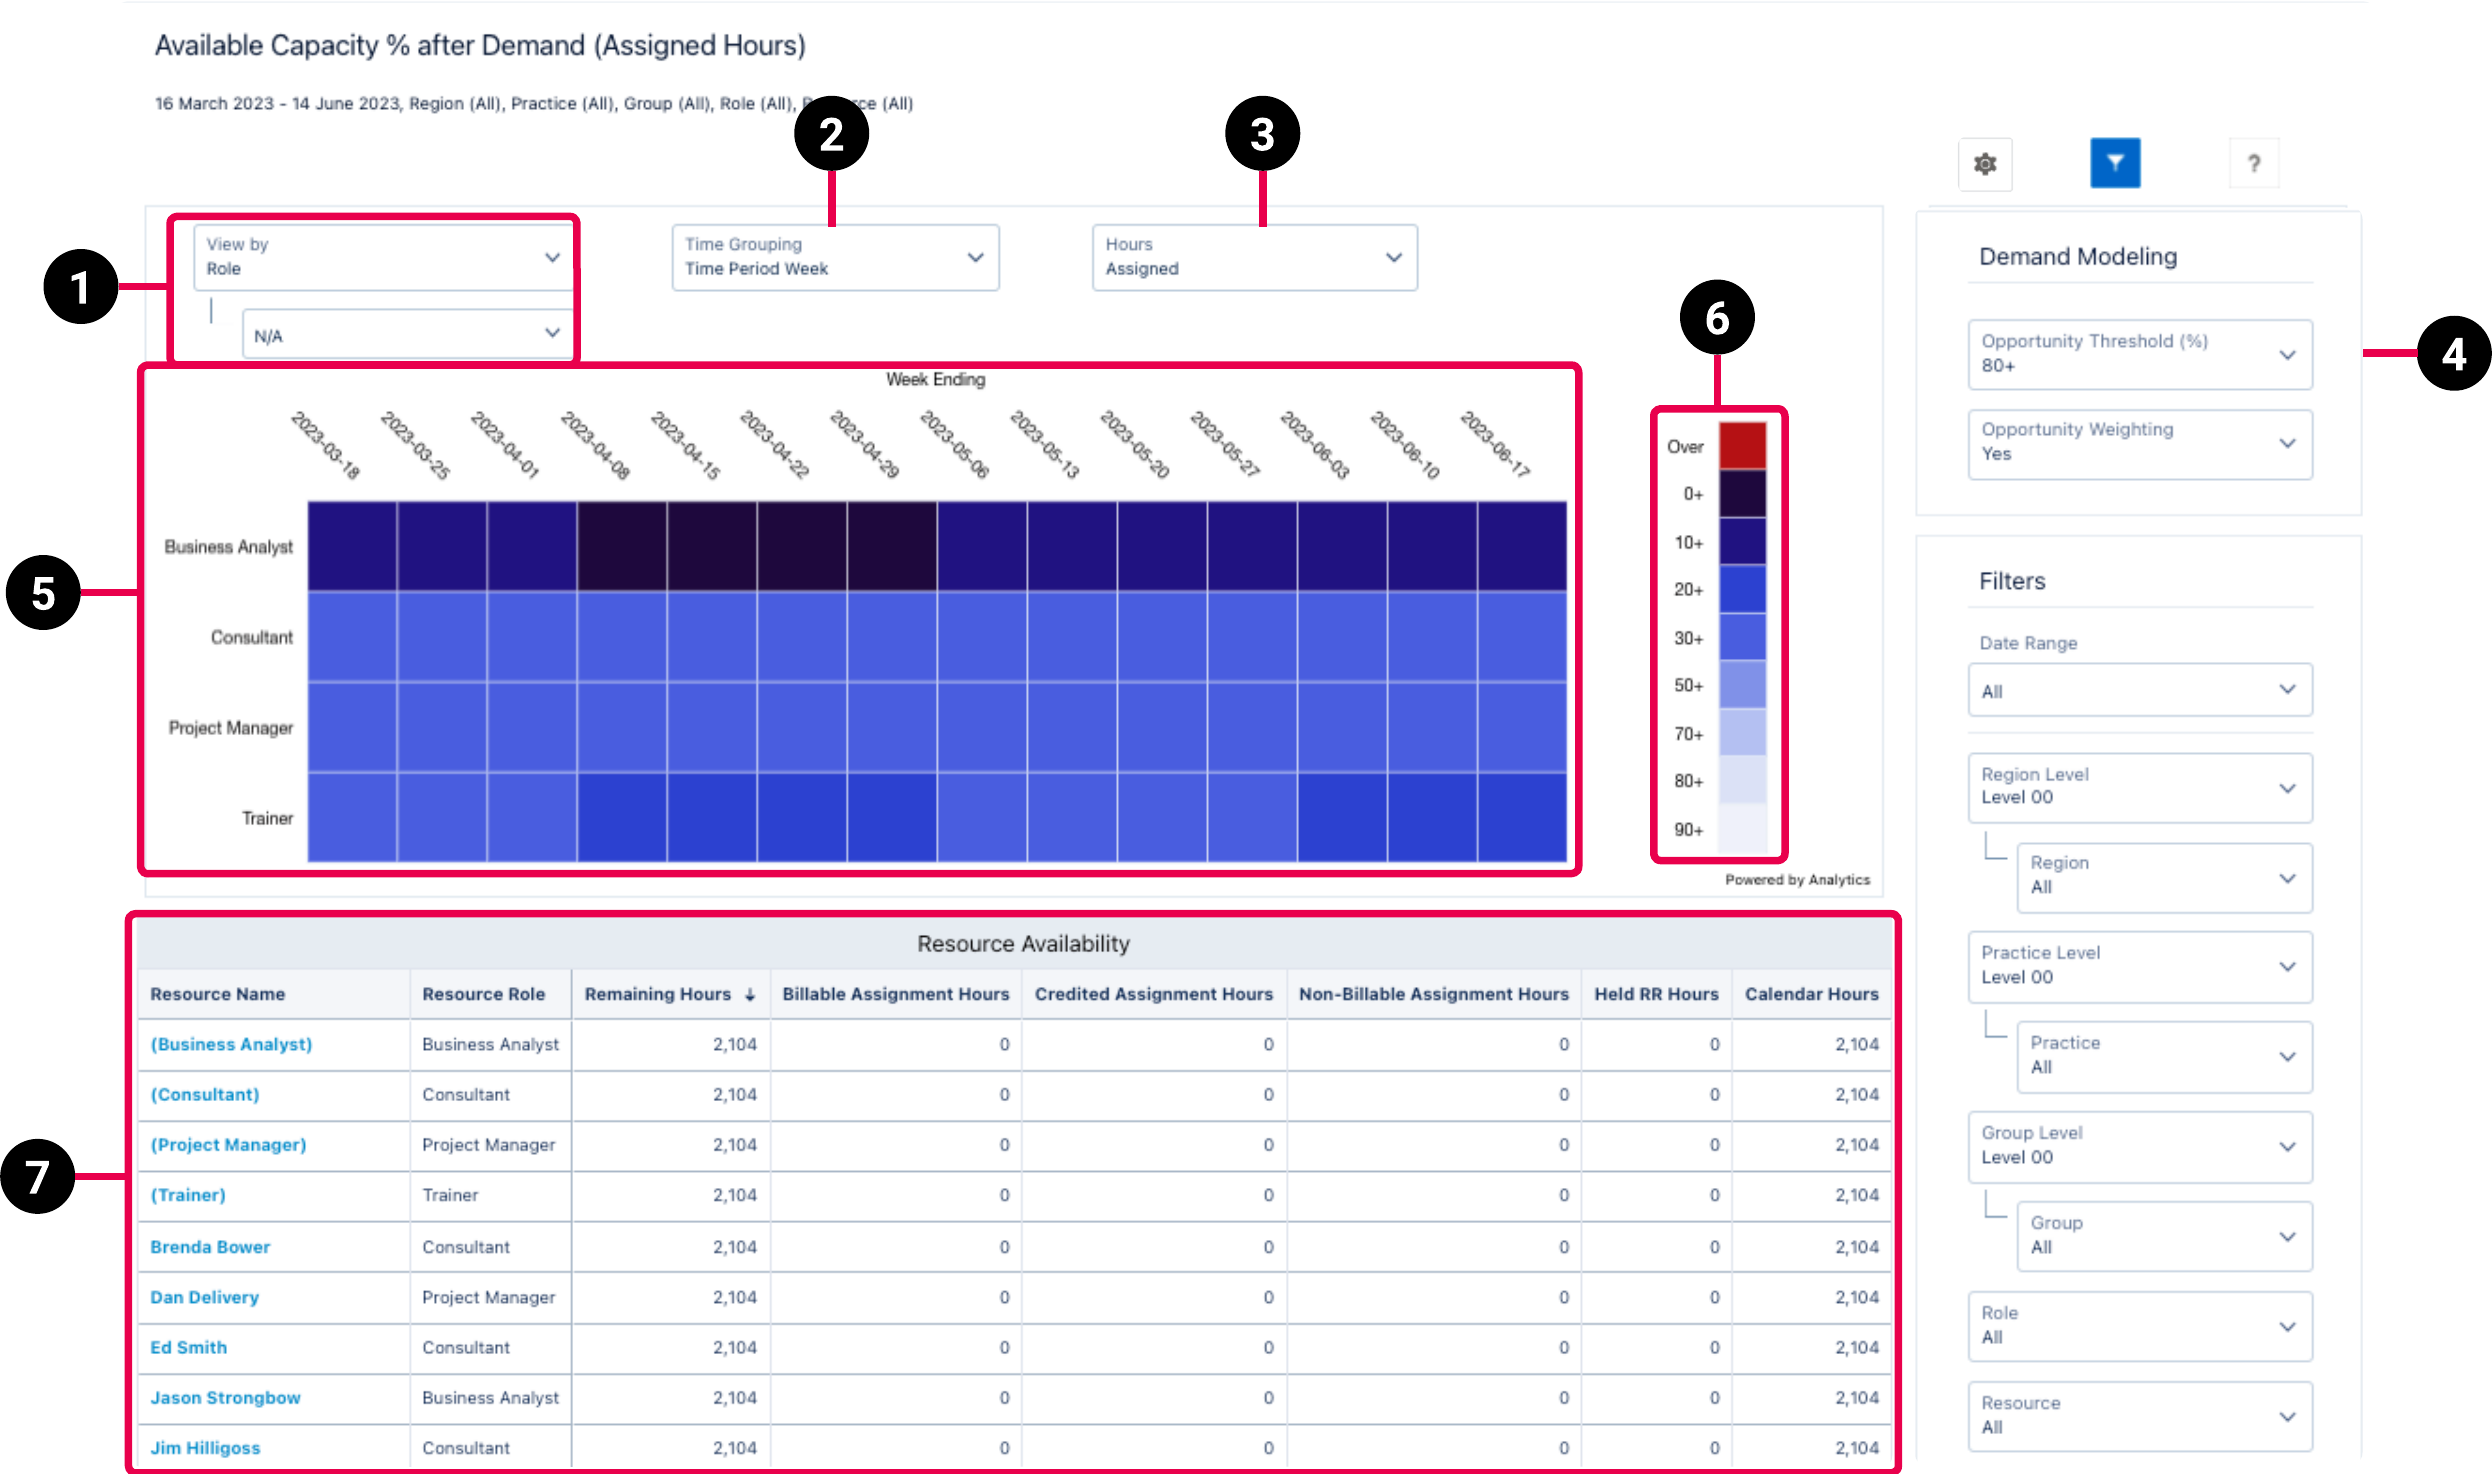
The PSA Utilization Analytics Capacity and Demand Planning dashboard has the following elements.
The dashboard displays data from the Utilization Results dataset. For more details about the fields used in the dashboard calculations, see Utilization Results Dataset PS Cloud Analytics Output Fields.
|
Element Number |
Name |
Description |
Calculation |
Referenced Calculation |
|---|---|---|---|---|
| 1. | View By Picker |
Defines the type of data displayed in the heat map. |
Role | Displays data by role. |
| Region | Displays data by region. | |||
| Practice | Displays data by practice. | |||
| Group | Displays data by group. | |||
| 2. | Time Grouping Picker | Defines the time grouping for the data displayed in the heat map. | Day | Date |
| Time Period (Week) | Time Period = Week | |||
| Time Period (Month) | Time Period = Month | |||
| 3. | Hours Picker | Defines the hours data displayed in the heat map. | Assigned = Billable Assignment Hours + Credited Assignment Hours + Non Billable Assignment Hours + Time Excluded Assignment Hours + Utilization Excluded Assignment Hours |
Displays assigned hours based on the calculation. |
Assigned + Held = Billable Assignment Hours + Credited Assignment Hours + Non Billable Assignment Hours + Time Excluded Assignment Hours + Utilization Excluded Assignment Hours + Held Resource Request Hours + Utilization Excluded Held RR Hours |
Displays assigned hours + held hours based on the calculation. | |||
Assigned + Held + Unheld = Billable Assignment Hours + Credited Assignment Hours + Non Billable Assignment Hours + Time Excluded Assignment Hours + Utilization Excluded Assignment Hours + Held Resource Request Hours + Utilization Excluded Held RR Hours + Unheld Resource Request Hours + Utilization Excluded Unheld RR Hours |
Displays assigned hours + held hours + unheld hours based on the calculation. | |||
Held = Held Resource Request Hours + Utilization Excluded Held RR Hours |
Displays held hours based on the calculation. | |||
Unheld = Unheld Resource Request Hours + Utilization Excluded Unheld RR Hours |
Displays unheld hours based on the calculation. | |||
| 4. | Demand Modeling |
Applies weighting by opportunity probablility % to your unheld demand hours. |
Not applicable | Not applicable |
|
Opportunity Threshold (%) filters out any unheld hours on resource requests where the probability percentage of the associated opportunity is below the selected value. For example, if you select 40+, then only unheld hours where the associated opportunity probability percentage on the resource request is greater than 40% are included. Threshold values are taken from the latest utilization run, and range from 0-100%. For more information, see Utilization Setup Fields. |
A maximum of six opportunity threshold values are available. | None | ||
| Opportunity Weighting defines if the probability percentage of the associated opportunity is applied to the unheld hours. For example, if a resource request has 120 unheld hours and the associated opportunity has a probability percentage of 60%, the weighted unheld hours would be calculated as 120*0.6 = 72 hours |
No = Yes = |
None | ||
| 5. | Heat Map |
Displays the distribution of remaining capacity for the value selected in the view by picker (1). If required, historical scheduling data can be included in the heat map. For more information, see Using the PSA Utilization Analytics Capacity and Demand Planning Dashboard Configuration Page. |
Remaining capacity = 1 - (sum(Hours) / sum(Calendar Hours), 2) Hours used are defined by the value selected in the hours picker (3). |
Hours = Resource Utilization Hours
|
| Calendar Hours = Resource Calendar Hours | ||||
| 6. | Remaining Capacity Legend |
Color code for the heat map that indicates the ranges of remaining capacity. |
Not applicable | Not applicable |
| 7. | Resource Availability List |
Details availability for all resources. Data is grouped by resource name and role and can be organized by any of the columns. If required, historical scheduling data can be included in the Resource Availability list. For more information, see Using the PSA Utilization Analytics Capacity and Demand Planning Dashboard Configuration Page. |
Remaining Hours = Calendar Hours - Billable Assignment Hours - Credited Assignment Hours - Non Billable Assignment Hours - Time Excluded Assignment Hours - Utilization Excluded Assignment Hours - Held Resource Request Hours - Utilization Excluded Held RR Hours |
None |
Billable Assignment Hours = Sum(Billable Assignment Hours) |
None | |||
Credited Assignment Hours = Sum(Credited Assignment Hours) |
None | |||
Non-Billable Assignment Hours = Sum(Credited Assignment Hours) |
None | |||
Held Resource Request Hours = Sum(Held Resource Request Hours) |
None | |||
Calendar Hours = Sum(Calendar Hours) |
None | |||
Time Excluded Assignment Hours = Sum(Time Excluded Assignment Hours) |
None | |||
Utilization Excluded Assignment Hours = Sum(Utilization Excluded Assignment Hours) |
None | |||
Utilization Excluded Held RR Hours = Sum(Utilization Excluded Held RR Hours) |
None |
Filters
The following filters are available on the PSA Utilization Analytics Capacity and Demand Planning dashboard. For more information about the dataset fields that provide the values for some of the dashboard filters, see Utilization Results Dataset PS Cloud Analytics Output Fields.
|
Name |
Description |
Source of Filter Options |
|---|---|---|
|
Date Range |
Select a specific time period to filter by, or select "Custom" to create your own time period to filter by. |
Filtered by the |
| Group | Select the specific groups to filter by, and apply the relevant operators to include or exclude them from the displayed data. | Dataset field: Group Name |
| Group Level | Select the specific group levels to filter by. Selections determine the options displayed in the Group filter. | Dataset field: Group Level XX, where XX represents a number between 00 and 12. |
| Practice | Select the specific groups to filter by, and apply the relevant operators to include or exclude them from the displayed data. | Dataset field: Practice Name |
| Practice Level | Select the specific practice levels to filter by. Selections determine the options displayed in the Practice filter. | Dataset field: Practice Level XX, where XX represents a number between 00 and 12. |
| Region | Select the specific groups to filter by, and apply the relevant operators to include or exclude them from the displayed data. | Dataset field: Region Name |
| Region Level | Select the specific region levels to filter by. Selections determine the options displayed in the Practice filter. | Dataset field: Region Level XX, where XX represents a number between 00 and 12. |
| Resource |
Select the specific resources to filter by, and apply the relevant operators to include or exclude them from the displayed data. |
Dataset field: Resource Name |
| Role | Select the specific resource roles to filter by. | Dataset field: Resource Role |
For more information about dashboard functionality, see Using the Dashboards Charts.
Full Time Equivalent (FTE)
You can view values for the Remaining FTE and Total FTE on the tooltip for the Available Capacity (%) by Role heatmap chart. These tooltip values are obtained for each resource, and then calculated based on the heatmap's chosen groupings using the following calculations:
|
Tooltip |
Time Period |
Dashboard Calculation |
Dataset |
|---|---|---|---|
| Remaining FTE | By day | Hours Remaining / (ValueStandardWorkCalendarHours * Unique Days) | Utilization Results |
| Total FTE | By day | Calendar Hours / ValueStandardWorkCalendarHours | Utilization Results |
| Hours Remaining | By day | Calendar Hours - Hours Used | Utilization Results |
| Hours Used for Assigned | By day | ValueBillableAssignmentHours + ValueCreditedAssignmentHours + ValueNonBillableAssignmentHours + ValueTimeExcludedAssignmentHours + ValueUtilizationExcludedAssignmentHours | Utilization Results |
| Hours Used for Held | By day | ValueHeldResourceRequestHours + ValueUtilizationExcludedHeldRRHours | Utilization Results |
| Unheld hours (when Opportunity Weighting is selected) | By day | ValueResourceRequestSOWHours | Project Reporting |
| Unheld hours (when Opportunity Weighting is not selected) | By day | ValueResourceRequestWeightedSOWHours | Project Reporting |
| Total FTE | By week |
Calendar Hours / (ValueStandardWorkCalendarHours * Unique Days)
|
Utilization Results |
| Remaining FTE | By week | Hours Remaining / (ValueStandardWorkCalendarHours * Unique Days) | Utilization Results |
| Total FTE | By month | Calendar Hours / (ValueStandardWorkCalendarHours * Unique Days) | Utilization Results |
| Remaining FTE | By month | Hours Remaining / (ValueStandardWorkCalendarHours * Unique Days) | Utilization Results |
Editing Dashboard Elements
You can edit some of the elements displayed in the dashboard, according to your reporting and presentational requirements.
 Editing the Available Capacity (%) Heatmap Chart Colors and Ranges
You can change the default colors and ranges displayed in the Available Capacity (%) heatmap chart, using the steps below.
- In Analytics Studio, navigate to the app containing the PSA Utilization Analytics Capacity and Demand Planning dashboard you want to edit.
- Click Edit to enter edit mode.
- Double-click the heatmap legend chart.
- In the New Custom Query modal that opens, amend your required ranges in the Threshold, Capacity Remaining (%), and availablePercentage columns.
- Click Done.
- In the Widget Editor, navigate to Conditional Formatting. You can now specify alternative colors to those provided as defaults in the dashboard.
- Edit the percentage values displayed in the Conditional Formatting menu to match the amended values in the Custom Query Modal. For example, if you specify an upper range of 70% in the Custom Query Modal, you must enter this value in the Conditional Formatting menu.
- Double-click the Available Capacity (%) heatmap chart.
- In the Widget Editor, navigate to Conditional Formatting. You must amend the colors and values displayed to reflect any changes you have made to the heatmap legend chart. This is to ensure that both charts contain identical ranges and colors.
- Click Preview | Save.
- [Optional] Enter a name. description, and version history for your dashboard.
- [Optional] Select the app you want to save your dashboard to.
- Click Save.