 SECTIONS
(Beta) PSA Services Forecast Dashboard
The PSA Services Forecast dashboard enables service leaders and project managers to:
- View revenue, cost, and margin information for Live forecasts imported from PSA and Working forecasts imported from WorkGrid by month or quarter
- View a breakdown of the sources of revenue, cost, and margin for Live and Working forecasts
- Compare revenue, cost, and margin information for Live and Working forecasts against historical forecasts from WorkGrid
We recommend you embed the dashboard on a new tab of your region, practice, or group Lightning page. For instructions on how to do this, see Embedding the PSA Services Forecast Dashboard.
The dashboard is available only on the PS Cloud Core Analytics app and displays data from the Services Forecast Reporting dataset.
PSA Services Forecast Dashboard Guide
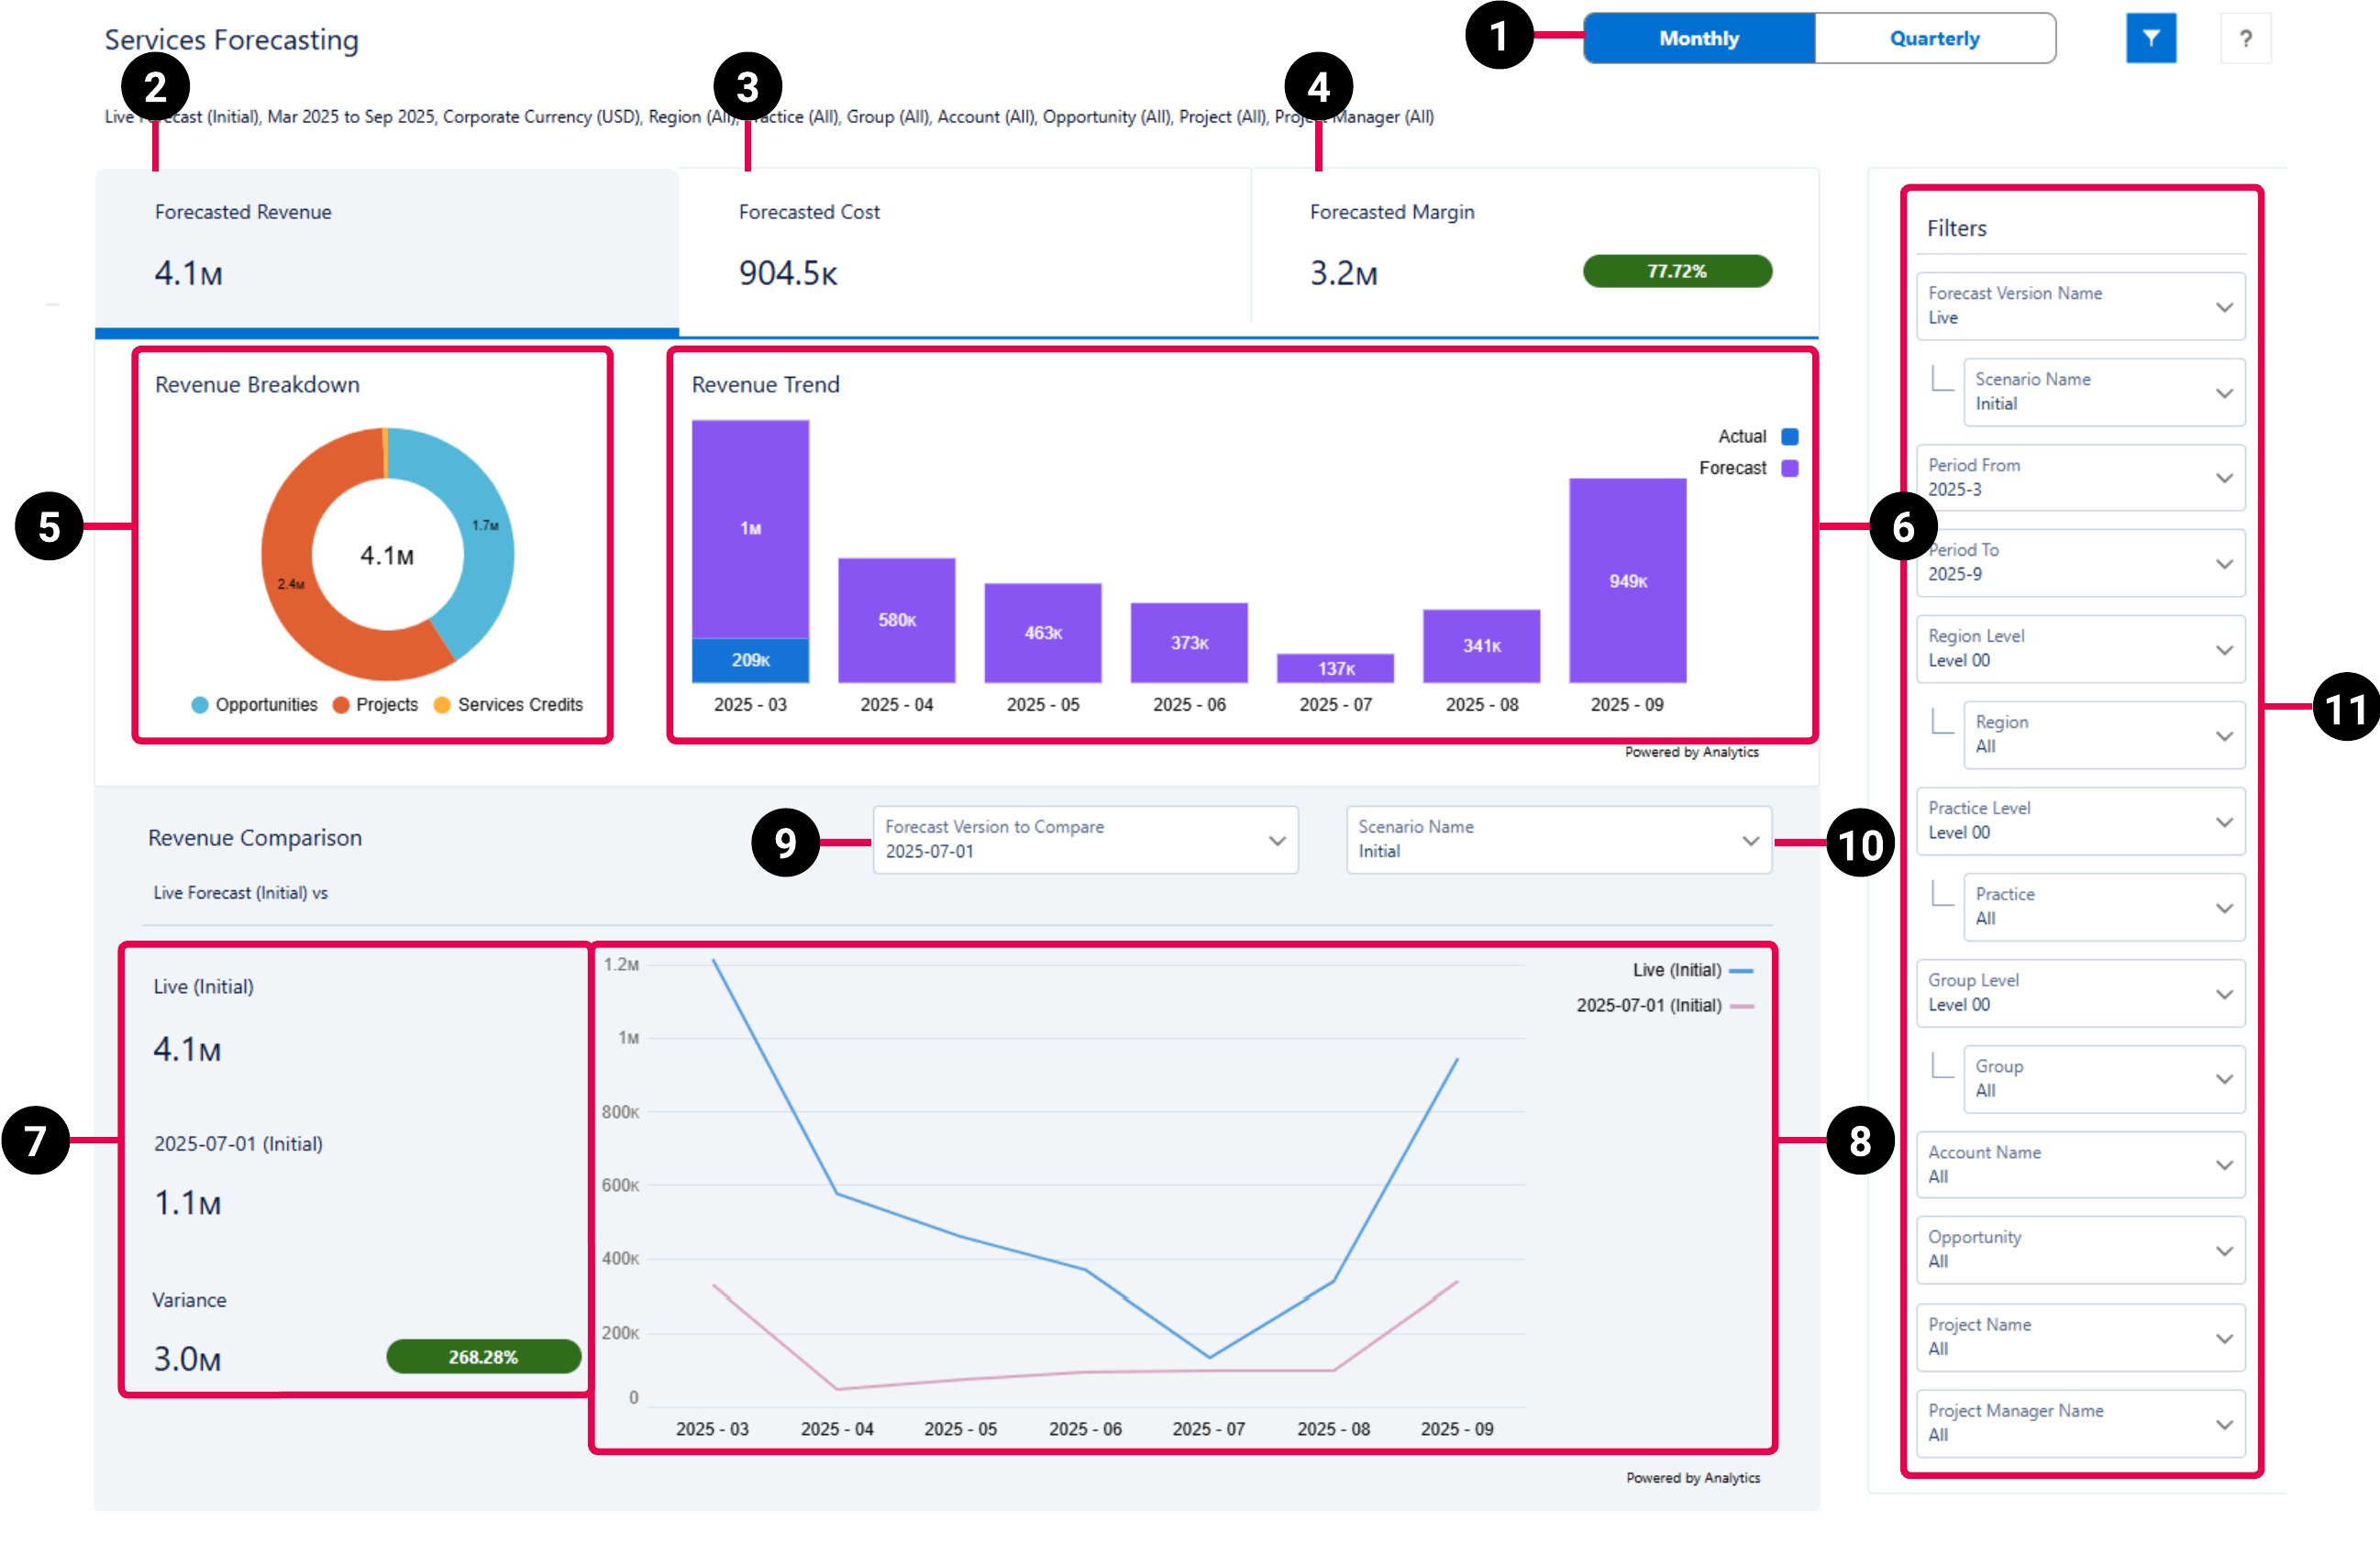
The PSA Services Forecast contains the following elements.
For more details about the fields used in the dashboard calculations, see (Beta) Services Forecast Reporting Dataset PS Cloud Analytics Output Fields.
|
Element Number |
Name |
Description |
Calculation |
|---|---|---|---|
| 1 | Period Picker |
Determines if the data displayed in the dashboard is grouped by month or quarter. |
Not applicable |
| 2 | Forecasted Revenue Summary Card | The total amount of forecasted revenue for the selected forecast version. If selected, revenue information displays in the breakdown chart (5), trend chart (6), comparison values (7), and comparison chart (8). |
Revenue = Amount (Corporate Currency), when Revenue/Cost = "Revenue" |
| 3 | Forecasted Cost Summary Card | The total amount of forecasted costs for the selected forecast version. If selected, cost information displays in the breakdown chart (5), trend chart (6), comparison values (7), and comparison chart (8). | Cost = Amount (Corporate Currency), when Revenue/Cost = "Cost" |
| 4 | Forecasted Margin Summary Card | Forecasted margin for the selected forecast version, expressed as an amount and as a percentage of the amount displayed in Forecasted Revenue (2). If selected, margin information displays in the breakdown chart (5), trend chart (6), comparison values (7), and comparison chart (8). |
Forecasted Margin amount = Forecasted Revenue amount - Forecasted Cost amount
Forecasted margin as a percentage of forecasted revenue = Forecasted Margin amount / Forecasted Revenue amount * 100 |
| 5 | Revenue, Cost, or Margin Breakdown Donut Chart | Displays a breakdown of the revenue, costs, or margin amounts attributed to the different sources of revenue for the selected forecast version. | Revenue, Cost, or Margin grouped by Level 1 |
| 6 | Revenue, Cost, or Margin Trend Bar Chart | Displays actual and forecasted revenue, costs, or margin grouped by the period type selected in the period picker (1). If Forecasted Margin (4) is selected, actual and forecast percentages also display on the chart. | Revenue, Cost, or Margin grouped by the period type selected in the period picker (1) |
| 7 | Revenue, Cost, or Margin Value Comparison |
Displays revenue, costs, or margin totals for the selected forecast version and forecast version to compare. Also displays the variance between the two values, expressed as an amount and a percentage. If Forecasted Margin (4) is selected, the margin amount expressed as a percentage of the revenue amount also displays for the selected forecast version and forecast version to compare. |
Variance amount = total for the selected forecast version - total for the selected forecast version to compare
Margin variance percentage = Variance amount - total for the forecast version to compare * 100 |
| 8 | Revenue, Cost, or Margin Comparison Line Chart | Displays a comparison of revenue, costs, or margin between the selected forecast and scenario, and the selected forecast version and scenario to compare. | Not applicable |
| 9 | Forecast Version to Compare Picker |
Determines the forecast version you want to compare against the forecast version selected in the Filters panel. |
Not applicable |
| 10 | Scenario Name Picker |
Determines the scenario associated with the forecast version you want to compare against the forecast version selected in the Filters panel. |
Not applicable |
| 11 | Filters | Filter panel used to refine the data displayed in the dashboard. By default, the Filters panel is open. For further information on the available filters, see Filters. | Not applicable |
Filters
The following filters are available on the PSA Services Forecast dashboard.
| Name | Description | Dataset Field |
|---|---|---|
| Forecast Version Name | Displays the available forecast versions. | Version |
| Scenario Name | Displays the available scenarios. | Scenario Name |
| Period From | Displays data from a specified date. | Filtered by Time Period Start Date, but Time Period Name is displayed in the picklist. |
| Period To | Displays data up to a specified date. | Filtered by Time Period End Date, but Time Period Name is displayed in the picklist. |
| Region Level | Displays available levels for regions. | Region Level 00 to Region Level 12 |
| Region | Displays regions at the level selected in Region Level. | Not applicable |
| Practice Level | Displays available levels for practices | Practice Level 00 to Practice Level 12 |
| Practice | Displays practices at the level selected in Practice Level. | Not applicable |
| Group Level | Displays available levels for groups. | Group Level 00 to Group Level 12 |
| Group | Displays practices at the level selected in Practice Level. | Not applicable |
| Account Name | Displays the data for a specified account name. | Account Name |
| Opportunity | Displays the data for a specified opportunity. | Opportunity Name |
| Project Manager Name | Displays the data for a specified project manager name. | Project Manager Name |
| Project | Displays data for a specified project. | Project Name |