 SECTIONS
PSA Services Forecast Dashboard Details View
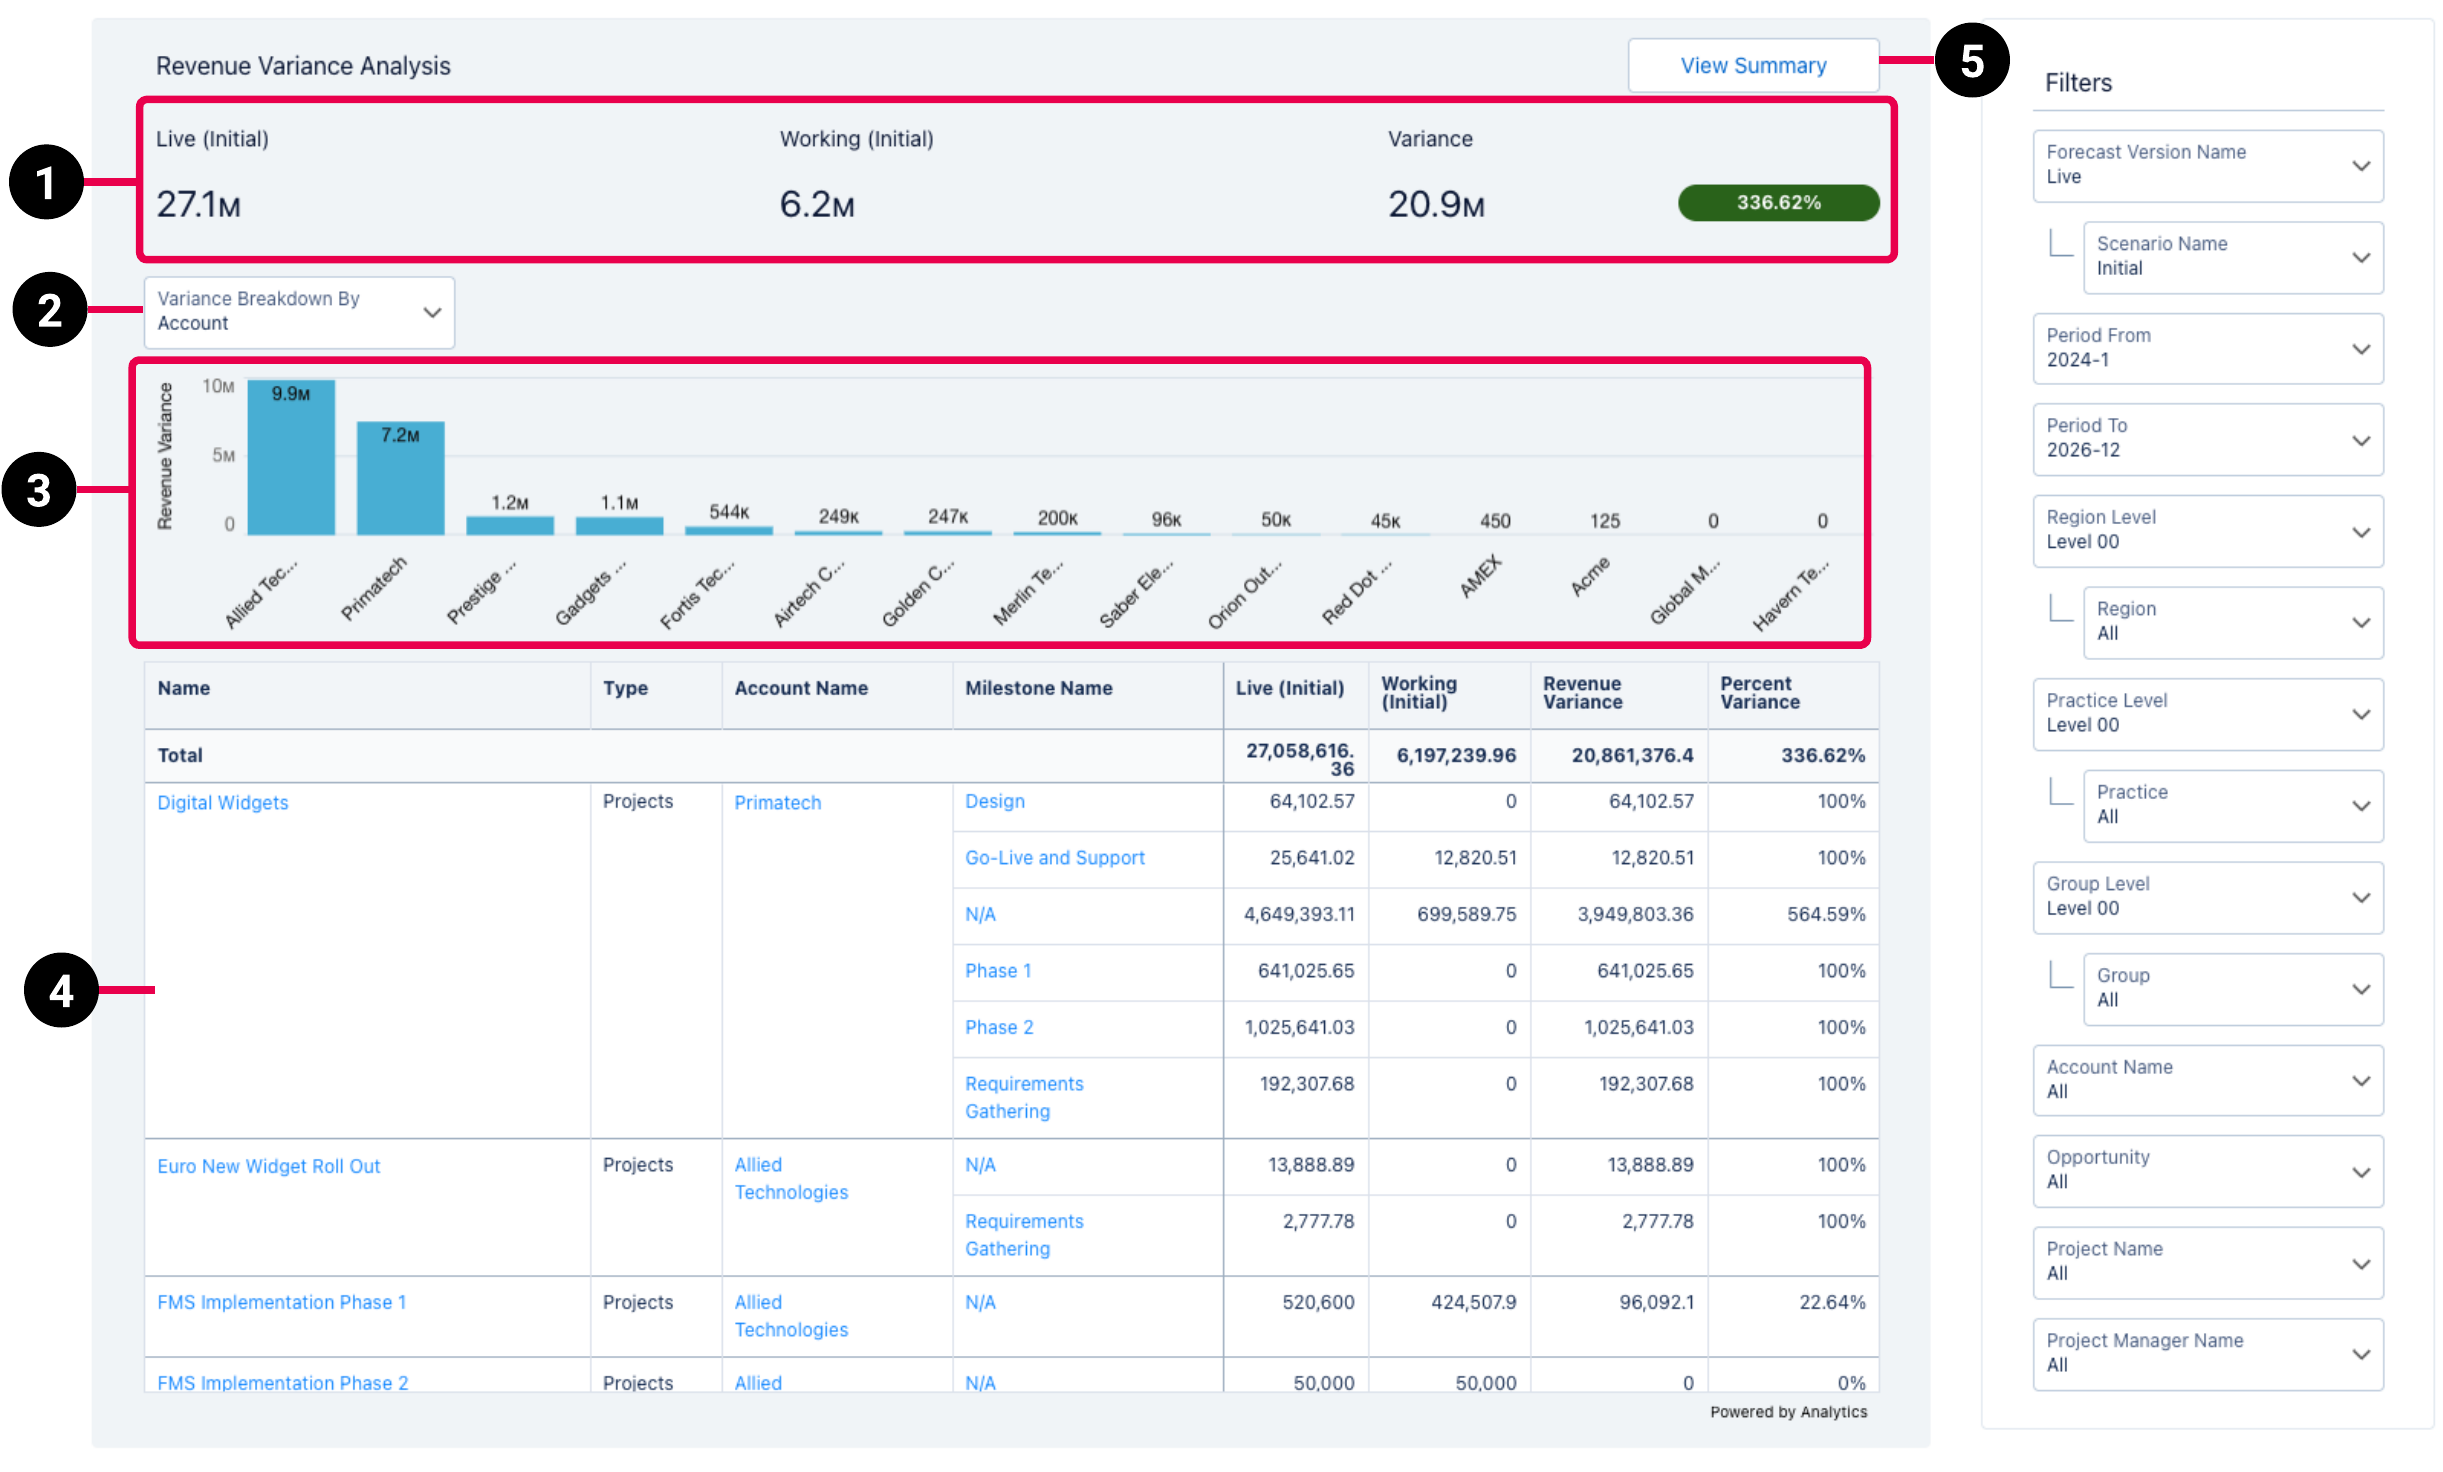
The details view of the PSA Services Forecast dashboard displays a breakdown of the specific accounts, opportunities, projects, or project managers that are the sources of revenue, cost, or margin variance. You can drill down further, by selecting individual bars in the variance bar chart, to view the variance between forecasts for milestones associated with the selected account, opportunity, project, or project manager.
The summary card selected in the summary view of the dashboard determines if revenue, cost, or margin information is displayed in the details view. You can change the selected forecast version and scenario in the Filters panel, and the selected forecast version and scenario to compare in the Forecast Version to Compare and Scenario Name pickers in the summary view of the dashboard. For more information, see (Beta) PSA Services Forecast Dashboard.
The details view of the PSA Services Forecast dashboard has the following elements.
| Element Number | Name | Description | Calculation |
|---|---|---|---|
| 1. | Revenue, Cost, or Margin Value Comparison |
Displays revenue, costs, or margin totals for the forecast version selected in the Filters panel and the forecast version to compare selected in the summary view. Also displays the variance between the two values, expressed as an amount and a percentage. In the details view for margin, the margin amount expressed as a percentage of the revenue amount also displays for the selected forecast version and forecast version to compare. |
Variance amount = total for the selected forecast version - total for the selected forecast version to compare
Margin variance percentage = Variance amount - total for the forecast version to compare * 100 |
| 2. | Variance Breakdown By Picker |
Determines how the data displayed in the variance breakdown bar chart (3) and details table (6) is broken down. The data can be displayed by:
|
Account = Account, Opportunity = Opportunity, Project = Project, and Project Manager = Project Manager. For more information about the dataset fields, see (Beta) Services Forecast Reporting Dataset PS Cloud Analytics Output Fields. |
| 3. | Variance Breakdown Bar Chart |
Displays revenue, cost, or margin variances by individual account, opportunity, project, or project manager, depending on your selection in the Variance Breakdown By picker (4). By default, variance is displayed in ascending order, with the source of the highest positive variance in the leftmost position in the chart. Select a bar in the chart to view the revenue, cost, or margin variance information for that specific source in the details table (6). |
Variance amount = total for the selected forecast version - total for the selected forecast version to compare, grouped by account, opportunity, project, or project manager |
| 4. | Account, Opportunity, Project, or Project Manager Details Table |
Displays revenue, costs, or margin, and variance information for the forecast version and forecast version to compare as a total and broken down by milestone. The table has the following columns:
|
Revenue Variance = total for the selected forecast version - total for the selected forecast version to compare
Percent variance = variance amount - total for the forecast version to compare * 100 |
| 7. | View Summary Button | Click to return to the summary view of the dashboard. For more information, see (Beta) PSA Services Forecast Dashboard. | Not applicable |