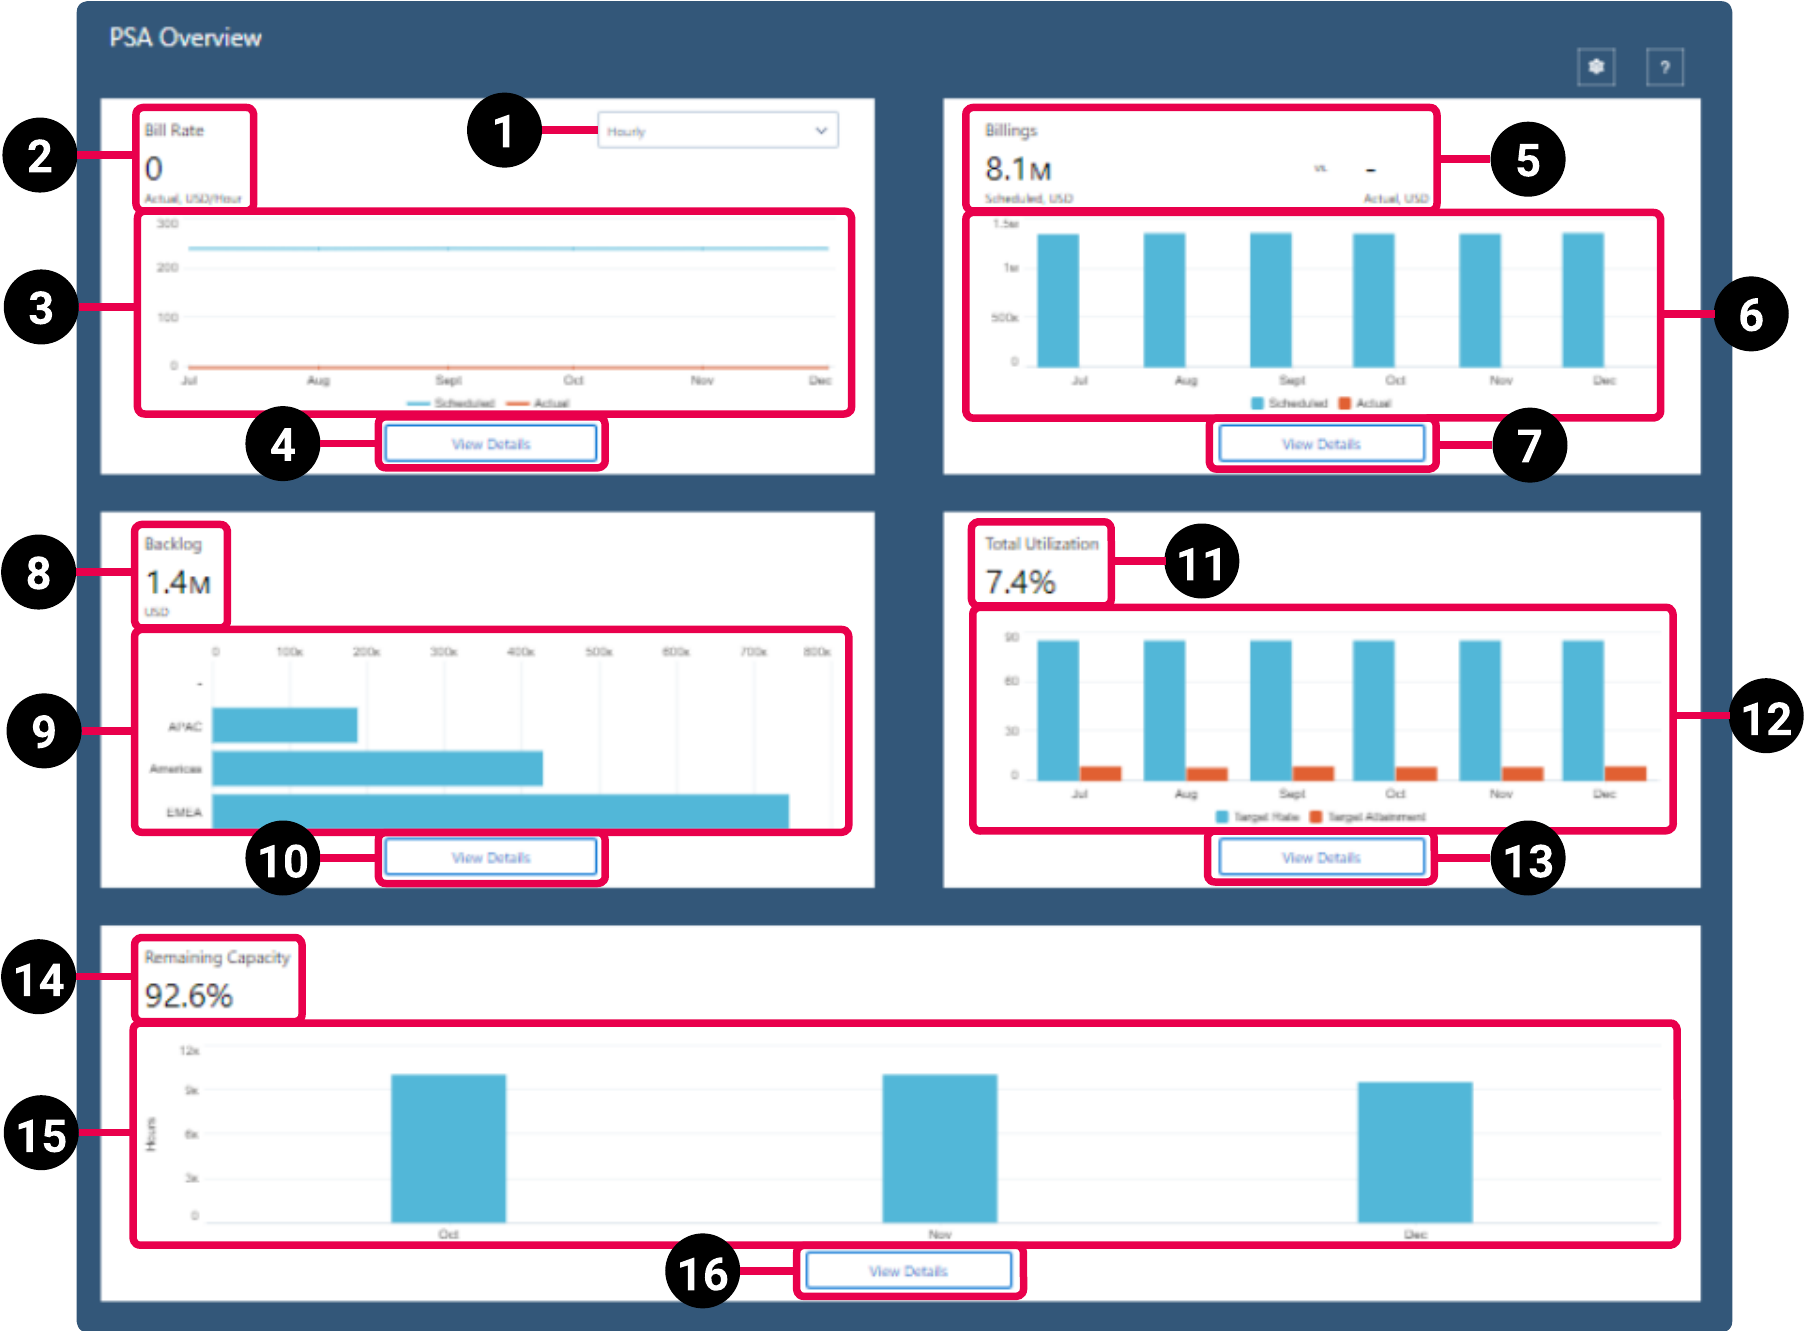
PSA Overview Dashboard
The PS Cloud Analytics PSA Overview dashboard components display a summary of your key performance indicators (KPIs) as well as complementary graphs that enable you to visualize your business trends. You can navigate to the KPI specific dashboard to view further details by clicking the View Details button or the title for any of the components.
This dashboard is created as part of the PS Cloud Advanced Analytics app.
PSA Overview Dashboard Guide

|
Element Number |
Name |
Description |
Calculation |
Referenced Calculation |
Source Dataset |
|---|---|---|---|---|---|
| 1. | View By Picker for Bill Rate Line Chart | Defines the data displayed in the Bill Rate line chart. | Daily | Displays daily bill rate. | Not applicable |
| Hourly | Displays hourly bill rate. | ||||
| 2. | Bill Rate KPI | Actual bill rate for the value selected in the view by picker (1). | Hourly Actual = Actual Bill Rate Billings Value / Actual Bill Rate Total Hours |
None | Billings Dataset PS Cloud Analytics Output Fields |
| 3. | Bill Rate Line Chart | Displays actual vs scheduled bill rate for the value selected in the view by picker (1). This is the effective bill rate for fixed fee and time and materials hours. | Daily Actual = Actual Bill Rate Total Days |
None |
|
Daily Scheduled = Scheduled Bill Rate Total Days |
None | ||||
Hourly Actual = Actual Bill Rate Billings Value / Actual Bill Rate Total Hours |
None | ||||
Hourly Scheduled = Scheduled Bill Rate Billings Value / Scheduled Bill Rate Total Hours |
None | ||||
| 4. | View Details | Click to view PSA Billings Dashboard. | Not applicable | Not applicable | |
| 5. | Billings KPI | Scheduled vs actual billing comparison. | Scheduled = Billings Value filtered by Subtype = Scheduled
|
None | |
Actual = Billings Value filtered by Subtype = Actual
|
None | ||||
| 6. | Billings Bar Chart | Displays a monthly comparison of actual vs scheduled billings. | Scheduled = Billings Value filtered by Subtype = Scheduled, grouped by End Date = Year-Month
|
None | |
Actual = Billings Value filtered by Subtype = Actual, grouped by End Date = Year-Month
|
None | ||||
| 7. | View Details | Click to view PSA Billings Dashboard. | Not applicable | Not applicable | |
| 8. | Backlog KPI | Backlog amount. | Sum of Backlog Amount, filtered by Has Project = Yes, Time Period and Start Date = This fiscal quarter, and Backlog Time Period Type = Month
|
None | Backlog Dataset PS Cloud Analytics Output Fields |
| 9. | Backlog Bar Chart | Displays backlog amount by region. | Sum of Backlog Amount, grouped by Project Region Level 01, filtered by Time Period and Start Date = This fiscal quarter, and Backlog Time Period Type = Month
|
None | |
| 10. | View Details | Click to view PSA Backlog Dashboard. | Not applicable | Not applicable | |
| 11. | Total Utilization KPI | Total utilization as a percentage of total hours. | Total Utilization (%) = sum(Billable Hours) + sum(Credited Hours) / sum(Calendar Hours) - sum(Excluded Hours)*100
|
None | Utilization Dataset PS Cloud Analytics Output Fields |
| 12. | Total Utilization Bar Chart | Displays a monthly comparison of utilization by target rate vs target attainment. | Target Rate = sum of Utilization Target Hours * 100 / sum of Calendar Hours |
None | |
Target Attainment = sum of Billable Hours + sum of Credited Hours * 100 / (sum of Calendar Hours - sum of Excluded Hours) * 100 / sum of Utilization Target Hours * 100 / sum of Calendar Hours |
None | ||||
| 13. | View Details | Click to view PSA Utilization Dashboard. | Not applicable | Not applicable | |
| 14. | Remaining Capacity KPI | Total remaining hours as a percentage of total hours. | Remaining Capacity = sum(Total Remaining Hours) / sum(Total Capacity Hours) *100
|
None | Capacity Dataset PS Cloud Analytics Output Fields |
| 15. | Remaining Capacity Bar Chart | Displays remaining capacity in hours by month. | Total Capacity Hours = sum of Total Capacity Hours, grouped by Utilization End Date = (Year-Month), filtered by Time Period Type = Month and Has Resource = Yes
|
None | |
| 16. | View Details | Click to view PSA Capacity Dashboard. | Not applicable | Not applicable |
For more information about dashboards in PS Cloud Analytics, see Using PS Cloud Analytics.
See the Salesforce Help for general information about using dashboards in Analytics.
 SECTIONS