 SECTIONS
PSA Project Overview Dashboard
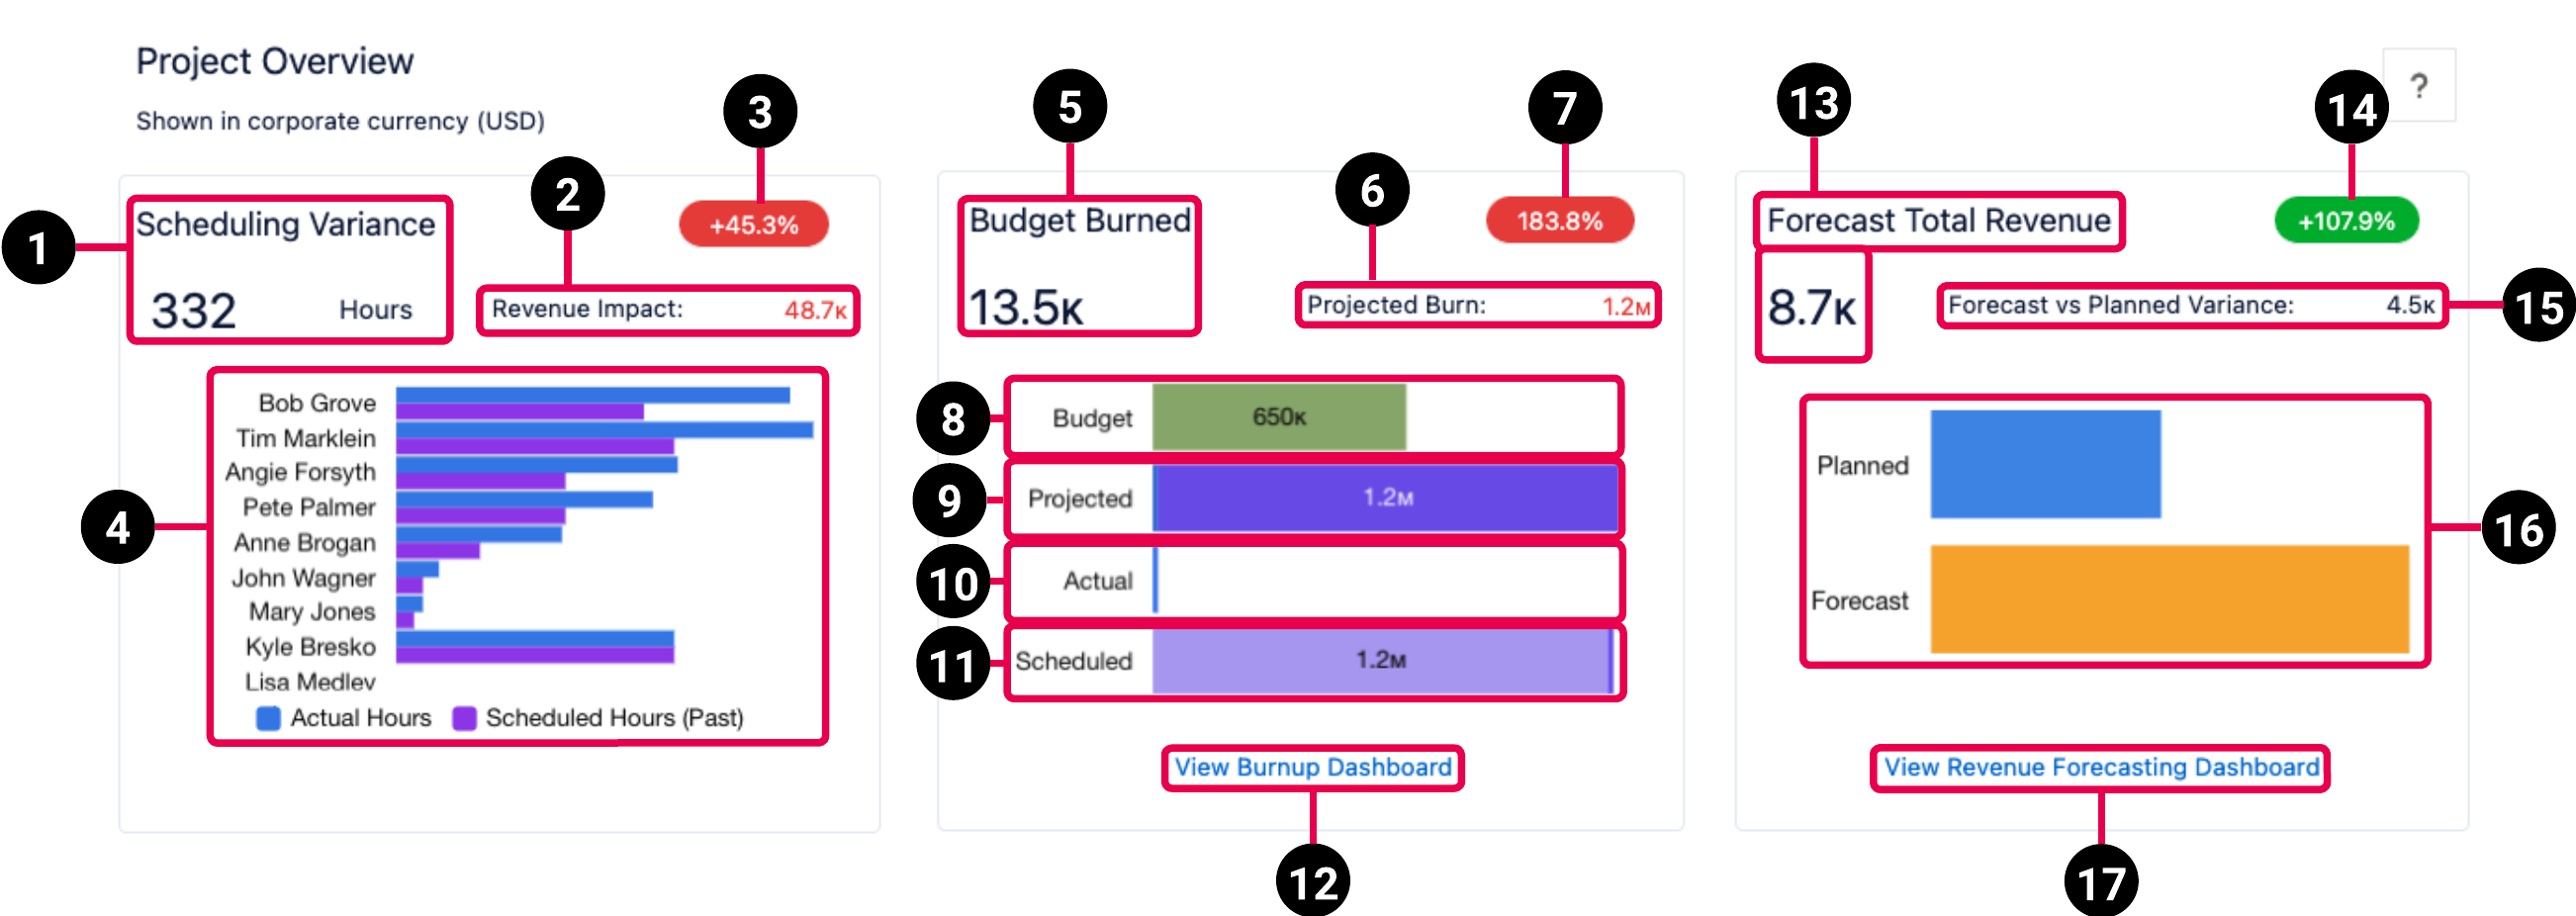
The PSA Project Overview dashboard contains up to three cards that display a summary of your project's financial key performance indicators (KPIs) as well as complementary charts that enable you to view the following:
- Scheduled versus actual hours and revenue variance for the last 13 weeks
- Total budget burned to date
- Forecast versus planned revenue variance for the current quarter
You can navigate to the KPI specific dashboard to view further details by clicking the view dashboard buttons at the bottom of each card. You need a PS Cloud Advanced Analytics app to view the PSA Project Scheduling Risk dashboard. For more information, see Adding the PSA Project Scheduling Risk Dashboard Button to PSA Project Overview.
This dashboard is created as part of the PS Cloud Core Analytics app.
PSA Project Overview Dashboard Guide
The PSA Project Overview dashboard is designed to be embedded on a project record and is configured to only display data for the current project. For more information, see Adding the PSA Project Overview Dashboard to the Project Lightning Page.
The dashboard has the following elements.
| Element Number | Name | Description | Calculation | Referenced Calculation | Source Dataset |
|---|---|---|---|---|---|
| Scheduling Variance Card | |||||
| 1. | Scheduling Variance KPI | Total difference between scheduled and actual hours for the last 13 weeks. | Scheduling Variance = EvA Actual Hours - EvA Estimated Hours |
Not applicable | Project Reporting Dataset Output Fields |
| 2. | Revenue Impact Amount KPI | Total difference between scheduled and actual revenue for the last 13 weeks. | Revenue Impact = EvA Actual Billable Amount - EvA Scheduled Amount |
Not applicable | |
| 3. | Hours Percent Variance KPI | Total difference between scheduled and actual hours for the last 13 weeks, expressed as a percentage. | EvA Actual Hours - EvA Estimated Hours / EvA Estimated Hours |
Not applicable | |
| 4. | Last 13 Weeks Actual versus Scheduled Hours Stacked Bar Chart | Displays the actual and scheduled hours for the last 13 weeks for each resource assigned to the project. The resource with the greatest absolute actual versus scheduled hours variance is listed at the top. Click the bars to view actual and scheduled hours and revenue variance details for each resource. | Actual hours = EvA Actual HoursScheduled Hours (Past) = |
Not applicable | |
| Budget Burned Card | |||||
| 5. | Budget Burned KPI | Total amount of the project's budget burned to date. | Budget Burned = Billings Value, filtered by
subtype = Actual |
Not applicable | Billings Dataset PS Cloud Analytics Output Fields |
| 6. | Projected Burn Amount KPI | Total projected billings amount for the project. | Projected Burn = Billings Value, filtered by
subtype = Actual or subtype = Scheduled |
Not applicable | |
| 7. | Projected Burn Percentage KPI | Percentage of project budget burned to date. | Projected Burn / Budget | Not applicable | |
| 8. | Budget Bar | Total amount of the project’s budget records in a bar chart. | Budget = Billings Value filtered by
Type = ”Budget”Budget values in the Billings dataset are filtered for the following types of budget:
|
Not applicable | |
| 9. | Projected Bar | Total projected billings amount for the project in a bar chart. | Projected = Billings Value, filtered by
subtype = Actual or subtype = Scheduled |
Not applicable | |
| 10. | Actual | Project actuals to date, broken down by timecards, milestones, misc adjustments, and expenses. | Actual = Billings Value filtered by
subtype = Actual
and grouped by Type |
Not applicable | |
| 11. | Scheduled | Remaining scheduled billings. | Scheduled = Billings Value filtered by
subtype = Scheduled
and grouped by Type |
Not applicable | |
| 12. | View Burnup Dashboard | Click to view the PSA Project Burnup dashboard filtered for the current project. | None | None | |
| Forecast Total Revenue Card | |||||
| 13. | Forecast Total Revenue KPI | Total forecast revenue for the current quarter. The Live forecast, which is your most recently calculated revenue forecast, is used to display your current actuals. For more information, see PSA Revenue Forecast Dashboard. | Forecast Total Revenue = Total Value filtered by Forecast Name = Live |
Not applicable | Revenue Forecast Dataset PS Cloud Analytics Output Fields |
| 14. | Forecast versus Planned Variance Percentage KPI | Total difference between forecast and planned revenue for the current quarter, expressed as a percentage. | Forecast vs Planned Variance (%) = (Forecast - Planned) / Planned | Not applicable | |
| 15. | Forecast versus Planned Variance Amount KPI | Total difference between forecast and planned revenue for the current quarter. | Forecast vs Planned Variance = Forecast - Planned | Not applicable | |
| 16. | Forecast versus Planned Revenue Stacked Bar Chart | Displays planned and forecast revenue for the current quarter in a bar chart. Click the bars to view planned, forecast, actual, and scheduled revenue details for the current quarter. |
Forecast = Planned = Forecast Version to Compare selected during configuration. For more information, see Using the PSA Project Overview Dashboard Configuration Page. |
Not applicable | |
| 17. | View Revenue Forecasting Dashboard | Click to view the PSA Revenue Forecast dashboard. To view the values displayed on the Forecast Total Revenue card in the PSA Revenue Forecast dashboard, filter the PSA Revenue Forecast dashboard by the periods that correspond with the current quarter. | None | None | |