 SECTIONS
PSA Project Scheduling Risk dashboard
The PSA Project Scheduling Risk dashboard enables you to:
- View a prioritized list of your projects that are most at risk of going over or under schedule based on hours variance percentage.
- Track the scheduled versus actual hours variance on your projects, and see how the variance has affected historical revenue and costs.
- Predict risks to future project scheduling based on historical hours variance for each resource.
- Define the number of past weeks to include in variance calculations and the number of future weeks to apply predictions to.
The dashboard is available only on the PS Cloud Advanced Analytics app, and is designed to complement the enhanced Project Management Workspace functionality available in PSA. For more information, see Project Management Workspace.
Prerequisites
The PSA Project Scheduling Risk dashboard only displays active projects that have at least one week of historical scheduled and actual hours data and information for individual resources that have submitted at least one week's worth of hours on the project. You must also have at least one EvA record with the Time Period Type of Week. For more information, see Estimates Versus Actuals.
PSA Project Scheduling Risk Dashboard Guide
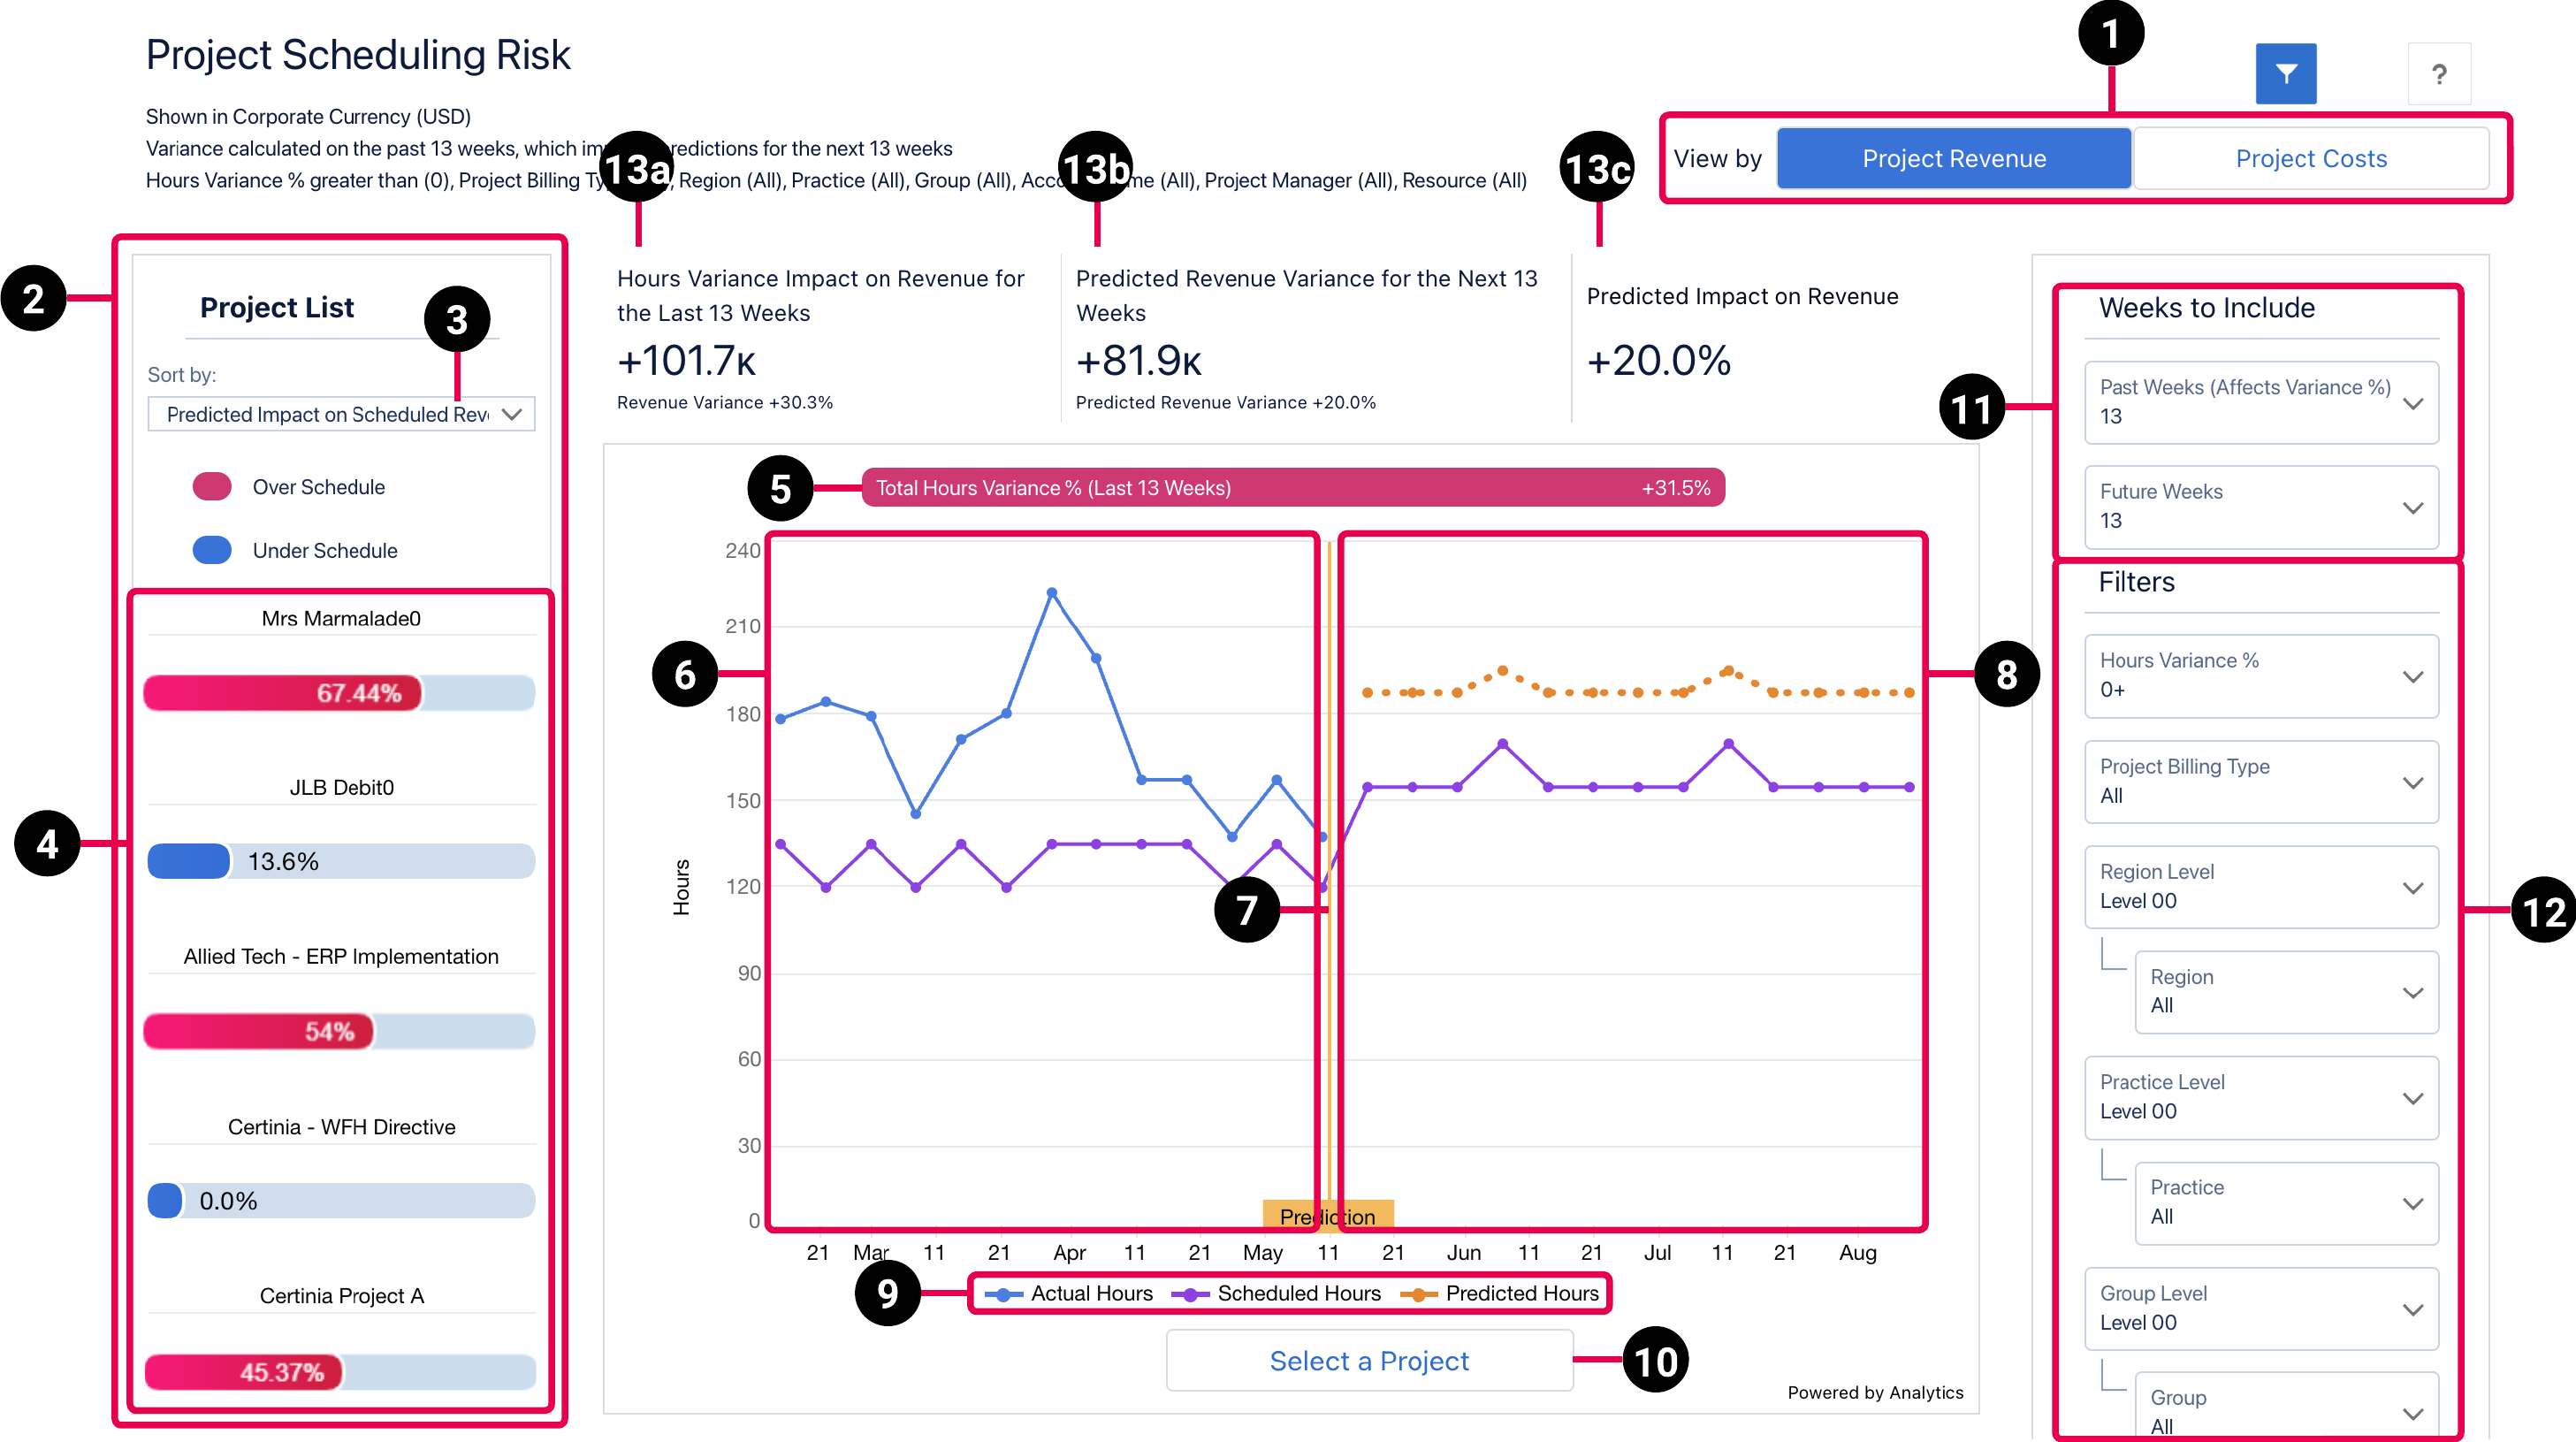
The PSA Project Scheduling Risk dashboard has a revenue view and a costs view, which you can toggle between to see the impact of schedule variance on your projects based on either revenue or costs. Calculated values displayed in each view are dependent on the past weeks and future weeks values selected in the Weeks to Include filters.
Project Revenue View
The revenue view of the dashboard has the following elements.
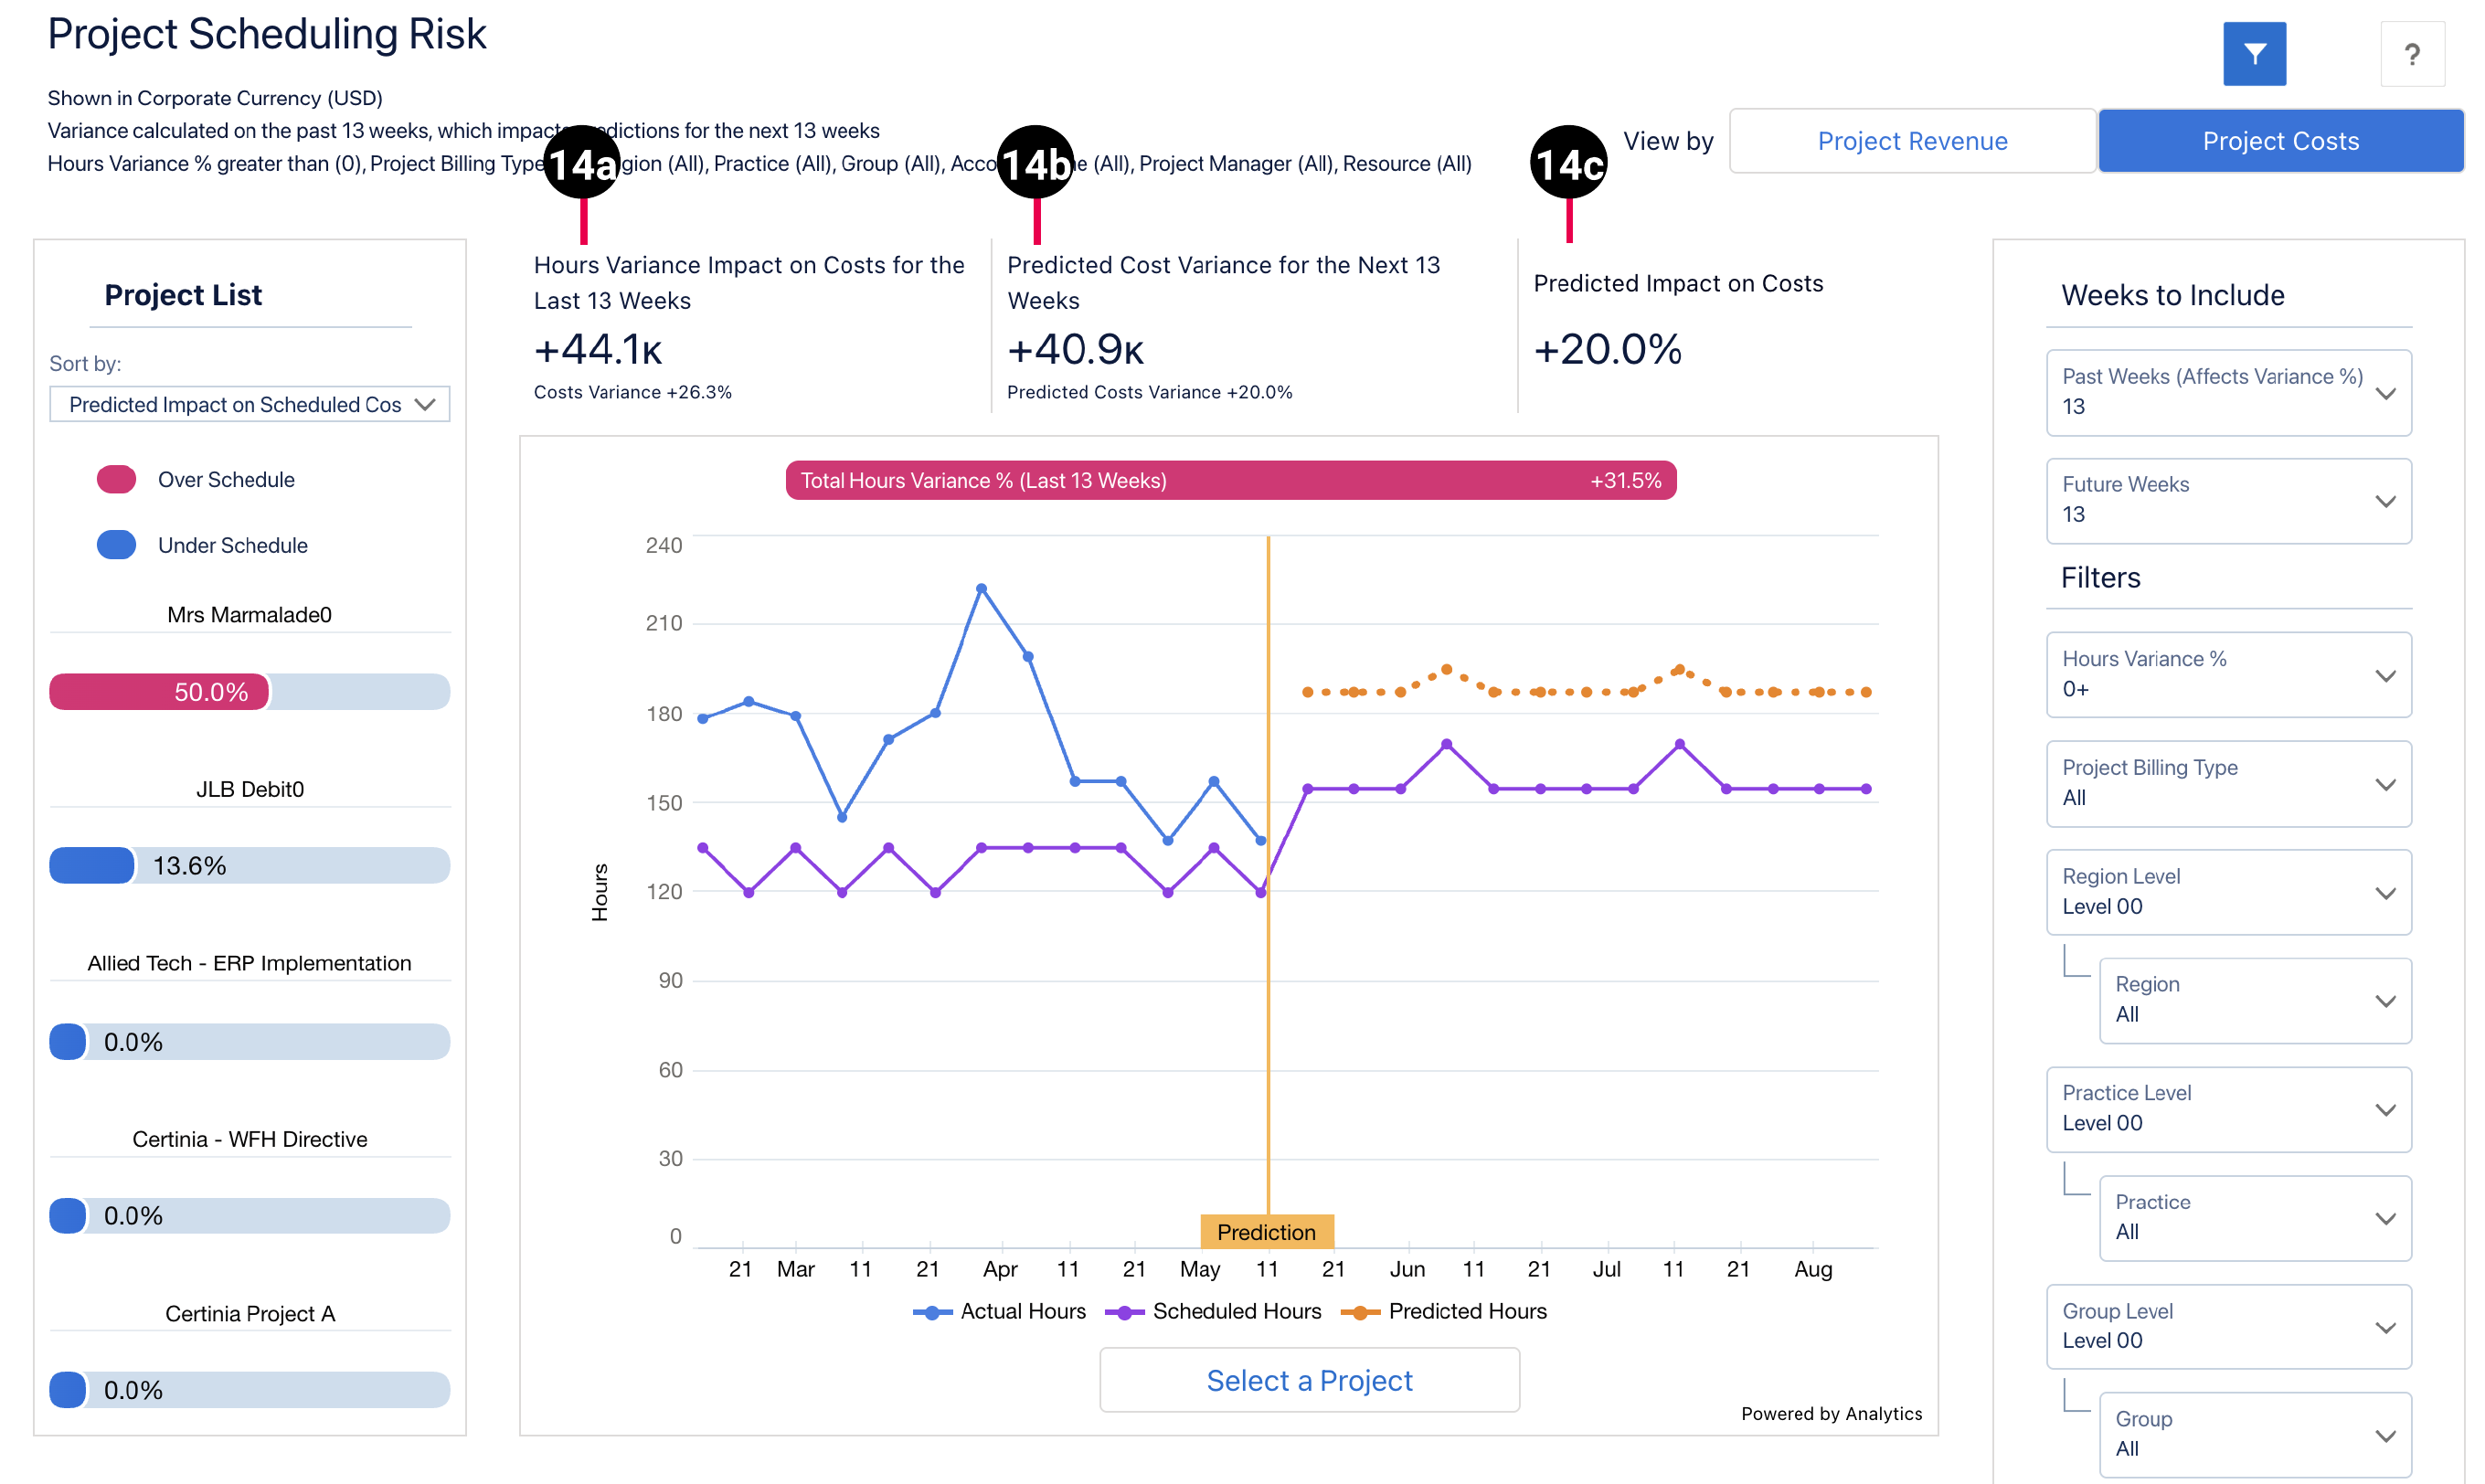
Project Costs View
The costs view of the dashboard has the following elements that differ from the revenue view.
The dashboard displays data from the Project Reporting dataset. For more details about the fields used in the dashboard calculations, see Project Reporting Dataset Output Fields.
| Element Number | Name | Description | Calculation | Referenced Calculation | ||
|---|---|---|---|---|---|---|
| 1. | View By Project Revenue or Project Costs Picker | Determines if project revenue or project cost data displays in the dashboard. | Not applicable | Not applicable | ||
| 2. |
Project List |
Lists your projects with the schedule variance, with the project with the highest absolute variance at the top. |
Not applicable | Not applicable | ||
| 3. |
Sort By Picker |
Sorts the project list by variance according to the following options:
|
Past Hours Variance % = (EvA Actual Hours - EvA Estimated Hours) / EvA Estimated Hours |
None | ||
| 4. |
Project Variance Bar |
Project variance shown as an absolute value, with over scheduled values displayed in pink and under scheduled values displayed in blue. A project is over-scheduled when the hours variance is over 0%, which indicates that there are more actual hours than scheduled hours for the selected number of past weeks. A project is under-scheduled when the hours variance is less than 0%, which indicates that there are fewer actual hours than scheduled hours for the selected number of past weeks. |
This value is derived by calculating the variance per resource, and aggregating to the project level. |
None |
||
| 5. |
Total Hours Variance % (Last XX Weeks) |
Consolidated hours variance percentage for the selected project, where XX indicates the number of past weeks selected in the Weeks to Include filter. The colors in the widget are represented in the same way as the legends on the project variance bar. |
(Actual Hours - Scheduled Hours) / Scheduled Hours |
( or
|
||
| 6. |
Line Chart (Last XX Weeks) |
Displays the scheduled and actual for the selected number of past weeks. |
Scheduled hours = Actual Hours = Revenue Variance = |
None | ||
| 7. | Prediction Flag | Indication of where the future hours prediction begins on the line chart. Predictions run from the start of the current week until the end of the selected future weeks period. | Not applicable | Not applicable | ||
| 8. |
Line chart (Next XX Weeks) |
Displays the scheduled and predicted hours for the selected number of future weeks. |
Scheduled Hours = Predicted Hours =
This value is derived by calculating the variance per resource, and aggregating to project level. |
None | ||
| 9. |
Chart legend |
Legend for the information displayed on the chart, which consists of the following:
|
Actual Hours =
Scheduled Hours =
Predicted Hours = |
None | ||
| 10. |
View project details |
Click to view more details about the selected project. You can drill down further to view information to role and resource level. For more information, see Viewing Project Details. |
Not applicable | Not applicable | ||
| 11. | Weeks to Include | Filter panel used to refine the number of past weeks to include in variance calculations and the number of future weeks to apply predictions to. By default, both past weeks and future weeks are set to 13. | Not applicable | Not applicable | ||
| 12. |
Filters |
Filter panel used to refine the data displayed in the dashboard. For further information on the available filters, see Managing Filters. |
Not applicable |
Not applicable | ||
| Calculations for Revenue | ||||||
| 13a. |
Hours Variance Impact on Revenue for the Last XX Weeks |
The impact of the hours variance on revenue for the selected number of past weeks, expressed as a percentage. |
Last XX weeks' Actual Revenue - Last XX weeks' Estimated Revenue |
|
||
| 13b. |
Predicted Revenue Variance for the Next XX Weeks |
The predicted variance in revenue variance for the selected number of future weeks, expressed as a percentage, and based on the revenue variance for the selected number of past weeks. |
Next XX weeks Predicted Revenue Variance = Next XX weeks Predicted Revenue - Next XX weeks Scheduled Revenue
Next XX weeks Predicted Revenue = Next XX weeks Predicted Hours * Scheduled Bill Rate
Next XX weeks Predicted Hours = Next XX weeks Scheduled Hours + (Next XX weeks Scheduled Hours * Last XX weeks Hours % Variance)
Next XX weeks Scheduled Revenue = Scheduled Hours * Scheduled Bill Rate |
|
||
| 13c. |
Predicted Impact on Revenue |
The impact of the selected project’s predicted revenue variance on the total scheduled revenue for all projects in the project list, expressed as a percentage. |
Predicted Revenue Variance for this project / Scheduled Revenue for all projects |
None |
||
| Calculations for Costs | ||||||
| 14a. |
Hours Variance Impact on Cost for the Last XX Weeks |
The impact of the hours variance on costs for the selected number of past weeks, expressed as a percentage. |
Last XX weeks Actual Costs - Last XX weeks Estimated Costs |
(EvA Actual Hours * Assignment Cost Rate) - (EvA Estimated Hours * Assignment Cost Rate) |
||
| 14b. |
Predicted Cost Variance for the Next XX Weeks |
The predicted variance in costs for the selected number of future weeks, expressed as a percentage, and based on the cost variance for the selected number of past weeks. |
Next XX weeks Predicted Costs Variance = Next XX weeks Predicted Costs - Next XX weeks Scheduled Costs
Next XX weeks Predicted Cost = Next XX weeks Predicted Hours * Assignment Bill Rate
Next XX weeks Predicted Hours: = Next XX weeks Scheduled Hours + (Next XX weeks Scheduled Hours * Last XX weeks Hours % Variance)
Next XX weeks Scheduled Cost: = Next XX weeks Scheduled Hours * Assignment Cost Rate |
|
||
| 14c. |
Predicted Impact on Costs |
Costs calculation displaying, as a percentage, the impact of the selected project’s predicted costs variance on the total scheduled revenue of all projects in the project list. |
Predicted Costs Variance for this project / Scheduled Costs for all projects |
None | ||
Managing Filters
The following filters are available on the PSA Project Scheduling Risk dashboard. For more information about the dataset fields that provide the values for the dashboard filters, see Project Reporting Dataset Output Fields.
|
Name |
Description |
Filter Source Information |
|---|---|---|
|
Account Name |
Select the account name you want to view all projects for, or select "All" to view projects for all accounts. |
Dataset Field: |
|
Group |
Select the specific groups to filter by, and apply the relevant operators to include or exclude them from the displayed data. |
Dataset field: Project Group Name |
| Group Level | Select the specific group levels to filter by. Selections determine the options displayed in the Group filter. | Dataset field: Project Group Level XX, where XX represents a number between 00 and 12. |
| Hours Variance % | Select a value to display only the data for projects with variance percentage higher than the selected value. | Fixed values: 0+ , 10+, and so on, up to 100+. |
| Practice | Select the specific groups to filter by, and apply the relevant operators to include or exclude them from the displayed data. | Dataset field: Project Practice Name |
| Practice Level | Select the specific practice levels to filter by. Selections determine the options displayed in the Practice filter. | Dataset field: Project Practice Level XX, where XX represents a number between 00 and 12. |
| Project Billing Type | Select a specific billing type to filter by. | Dataset field: Project Billing Type |
| Project Manager | Select the specific project managers to filter by, and apply the relevant operators to include or exclude them from the displayed data. | Dataset field: Project Manager Name |
| Region | Select the specific groups to filter by, and apply the relevant operators to include or exclude them from the displayed data. | Dataset field: Project Region Name |
| Region Level | Select the specific region levels to filter by. Selections determine the options displayed in the Region filter. | Dataset field: Project Region Level XX, where XX represents a number between 00 and 12. |
| Resource | Select the specific resources to filter by, and apply the relevant operators to include or exclude them from the displayed data. | Dataset field: Resource Name |
| Role | Select the specific resource roles to filter by, and apply the relevant operators to include or exclude them from the displayed data. | Dataset field: Resource Role |
| Zero Hour Assignments | Select if you want to include or exclude resources that are assigned zero hours schedules on project assignments from calculations and charts. | Includes or excludes resources with a Scheduling Strategy value of "Zero Hours Schedule" on project assignments. |
Suggested Use Cases
You can explore and view the data displayed in this dashboard to analyze the trends and take critical business decisions, such as:
- Prioritize the projects that have the most variance or have caused the most impact on revenue at a glance.
- Track the changes in hours variance for a selected number of past weeks for problematic projects.
- Predict future hours variance based on past actual hours variance.
- Take the necessary action to mitigate hours variance in the future to reduce its impact on project revenue.
We recommend you embed the dashboard on either a new tab of your project Lightning page, or the Project Management Workspace. For more information, see Embedding the PSA Project Scheduling Risk Dashboard.
The dashboard is created as part of the PS Cloud Advanced Analytics app.
Use case for Fixed Fee projects
- Fixed Fee projects are those that have a fixed revenue. The hours variance in these projects do not have an impact on revenue. However, if resources work more and submit timecards with more hours than the scheduled hours then the project margin will be lower.