 SECTIONS
PSA Project Forecast Dashboard
The PSA Project Forecast dashboard enables project managers to monitor how project revenue, cost, and margin is predicted to perform against budget. You can:
- View forecasted versus budgeted revenue, cost, and margin at project level.
- View a breakdown of forecasted revenue, cost, and margin by individual project item, such as a milestone, expense, or miscellaneous adjustment.
- View a breakdown of forecasted revenue, cost, or margin by individual project item for the current quarter, next quarter, and future project periods.
You can view the dashboard directly from the Project Forecast tab of a project's record page.
The dashboard is available only in the PS Cloud Core Analytics app and displays data from the Services Forecast Reporting dataset.
PSA Project Forecast Dashboard Guide
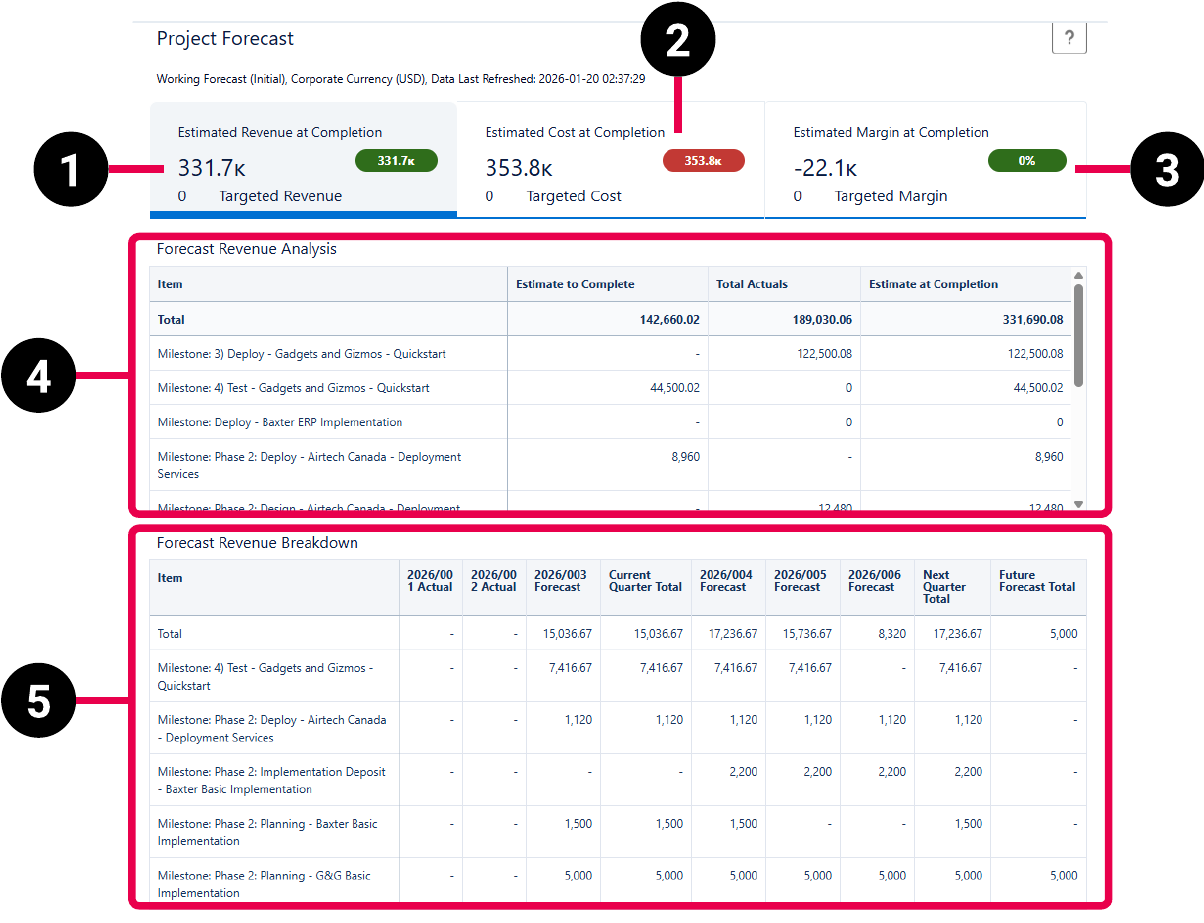
The PSA Project Forecast has the following elements.
For more information about the fields used in the dashboard calculations, see Services Forecast Reporting Dataset PS Cloud Analytics Output Fields.
| Element Number | Name | Description | Calculation |
|---|---|---|---|
| 1. | Estimated Revenue at Completion Summary Card | Displays the total forecasted amount of revenue at completion of the project, the budgeted amount of revenue for the project, and the difference between the two amounts. Differences are displayed in green if the forecasted amount is greater than the budgeted amount, and in red if the budgeted amount is greater than the forecasted amount. |
Estimated Revenue at Completion = Estimate to Complete + Total Actuals, when:
|
|
Targeted Revenue = sum(
|
|||
| 2. | Estimated Cost at Completion Summary Card | Displays the total forecasted cost at completion of the project, the budgeted cost for the project, and the difference between the two amounts. Differences are displayed in red if the forecasted amount is greater than the budgeted amount, and in green if the budgeted amount is greater than the forecasted amount. |
Estimated Cost at Completion = Estimate to Complete + Total Actuals, when:
|
|
Targeted Cost = sum(
|
|||
| 3. | Estimated Margin at Completion Summary Card |
Displays the total forecasted margin at completion of the project, the budgeted margin for the project, and the difference between the two amounts. Differences are displayed in green if the forecasted amount is greater than the budgeted amount, and in red if the budgeted amount is greater than the forecasted amount. You can hover over the forecasted margin value to view the following:
|
Estimated Margin at Completion = Estimated Revenue at Completion - Estimated Cost at Completion, when:
|
| Targeted Margin = Targeted Revenue - Targeted Cost | |||
|
Estimated Margin at Completion % = ((Estimated Revenue at Completion - Estimated Cost at Completion) / Estimated Revenue at Completion) * 100 Targeted Margin % = ((Targeted Revenue - Targeted Cost) / Targeted Revenue) * 100 Variance % = Estimated Margin at Completion % - Targeted Margin % |
|||
| 4. | Forecasted Revenue, Cost, or Margin Analysis Table |
Displays estimated and actual amounts for the project's forecasted revenue, cost, or margin as a total, and broken down by individual project item. The table has the following columns:
|
Estimate to Complete = sum(
|
|
Total Actuals = sum(
For forecasted revenue analysis, Revenue/Cost = "Revenue". For forecasted cost analysis, Revenue/Cost = Cost. Forecasted margin analysis = Total Actuals from the Forecasted Revenue Analysis table + Total Actuals from the Forecasted Cost Analysis table. |
|||
| Estimate at Completion = Estimate to Complete + Total Actuals | |||
| 5. | Forecasted Revenue, Cost, or Margin Breakdown Table | Displays forecasted revenue, cost, or margin as a total, and broken down by individual project item, for the current quarter, next quarter, and future project periods. The data in the table is broken down by month and quarter. The Past Actuals Total, and any past months in the current quarter display an actual value. Current or future months in the current quarter display a forecast value. | Past Actuals Total = The sum of all actuals values for all periods before the current quarter. |
|
Current Quarter Total = The sum of all actual or forecast values for the current quarter when:
|
|||
| Next Quarter Total = The sum of all forecast values for the next quarter. | |||
| Future Forecast Total = Total revenue, cost, or margin for all project periods after the end of the next quarter. |