The PSA Analytics dataflow generates the following datasets:
Backlog
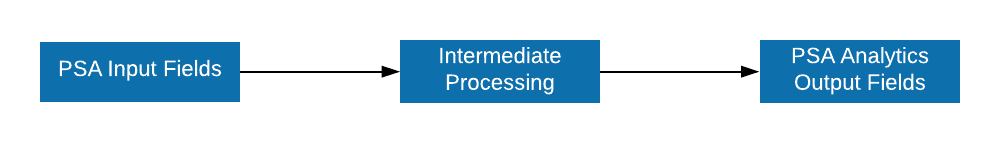
The image below shows a simplified schema of the general flow of the data for this dataset. For a full view of the PSA Analytics Dataflow and its nodes use the data manager tool in Analytics Studio. Click on any element of the image to open its detailed information page.
Billings
The image below shows the general flow of the data for this dataset. From left to right: the ingested fields from PSA, the calculations implemented, the filtering done to the fields, and the output fields displayed by PSA Analytics. Click on any element of the image to open its detailed information page.
Capacity
The image below shows the general flow of the data for this dataset. From left to right: the ingested fields from PSA, the calculations implemented, the filtering done to the fields, and the output fields displayed by PSA Analytics. Click on any element of the image to open its detailed information page.
Utilization
The image below shows the general flow of the data for this dataset. From left to right: the ingested fields from PSA, the calculations implemented, the filtering done to the fields, and the output fields displayed by PSA Analytics. Click on any element of the image to open its detailed information page.
Billing Forecast Details
The image below shows the general flow of the data for this dataset. From left to right: the ingested fields from PSA, the calculations implemented, the filtering done to the fields, and the output fields displayed by PSA Analytics. Click on any element of the image to open its detailed information page.
Billing Forecast Summaries
The image below shows the general flow of the data for this dataset. From left to right: the ingested fields from PSA, the calculations implemented, the filtering done to the fields, and the output fields displayed by PSA Analytics. Click on any element of the image to open its detailed information page.
Project Margin
The image below shows the general flow of the data for this dataset. From left to right: the ingested fields from PSA, the calculations implemented, the filtering done to the fields, and the output fields displayed by PSA Analytics. Click on any element of the image to open its detailed information page.
Revenue Forecast
The image below shows the general flow of the data for this dataset. From left to right: the ingested fields from PSA, the calculations implemented, the filtering done to the fields, and the output fields displayed by PSA Analytics. Click on any element of the image to open its detailed information page.
Currency ISO Code
The Currency ISO Code dataset uses the currency associated with the analytics integration user to display the ISO code for the currency shown in the dashboards. This dataset is used by all of the PSA Analytics dashboards except Utilization and Capacity (Hours).
For more information about the fields that are included in the Currency ISO Code dataset, see Currency ISO Code Fields.