Subscription Bookings Dashboard
The Subscription Bookings dashboard enables you to review the performance of your subscription revenue over time.
The charts on the Summary, Waterfall and By Dimension pages display data derived from The Billing Contracts Dataset. For more information on the fields and objects used in this dataset, see "Datasets" in Using Financial Analytics Dashboards.
The pages in this dashboard correspond to different views of your subscription bookings. To navigate between the different pages, click the relevant name in the dashboard's top header. You can configure the pages in the Subscription Bookings to display the recurring revenue as the annual recurring revenue (ARR) or the monthly recurring revenue (MRR).
|
Pages |
Description |
|---|---|
| Summary |
This page displays a general view of the status of your current Subscription Bookings, your subscription pipeline status, renewal rate and its impact in your business. The Summary page consist of the following components:
For information on how to use the Summary page, see Using the Subscription Bookings Summary. |
| Waterfall | This page provides a detailed view of the recurring revenue pipeline, enabling you to review the performance of your subscription revenue over time. The page consists of charts and drill tables that correspond to key performance indicators (KPIs), displayed between the starting recurring revenue and ending recurring revenue for your selected dates. For information on how to use the Waterfall page, see Using the Subscription Bookings Waterfall. |
| By Dimension |
This page enables you to perform dimensional analysis for each of your KPIs, based on your ending MRR or ARR. The charts displayed on this page contain drop-down menus where you can select and change the dimensions you want to analyze and compare. For information on how to use the By Dimension page, see Using Dimensional Analysis. |
Managing Filters
The Subscription Bookings dashboard provides two different type of filters:
- The Page Filter selections determine the data displayed for each of your KPIs within their respective dashboard page.
- The Global Filter selections determine the data displayed for each of your KPIs within the dashboard and across all its pages.
To hide the filters click  . Click again to show the filters.
Page Filters
Your page filter selections determine the data displayed for each of your KPIs within their respective dashboard page. The following page filters are available in the Subscription Bookings dashboard:
|
Subscription Bookings Page |
Filter Actions |
|---|---|
| Summary |
The charts displayed on the Subscription Bookings Summary, Open Renewals, and Contract Churn pages can be filtered by year and quarter. Select the year and quarter to be used as a reference point for all charts and gauges:
|
| Open Renewals Details | |
| Contract Churn Details | |
| Waterfall |
The charts displayed on the Subscription Bookings Waterfall and Dimensional Analysis pages can be filtered by date range. This is treated inclusively when selecting start and end dates for your recurring revenue. For example, if you specify a starting date of January 1, 2019 and ending date of January 31, 2019, then your starting recurring revenue includes contract data from December 31 and your ending recurring revenue contains contracts that were active on or after January 1, 2019 and end on or after January 31, 2019. The available date range from which to display the start and end dates of your recurring revenue is derived from the years and periods available in your configuration of Accounting. In addition, the date format displayed in the chart sub-heading and drill table reflects the date format set in the org of the user who configured the app. For more information, see the Accounting Help. |
| Dimensional Analysis |
Global Filters
Your global filter selections determine the data displayed for each of your KPIs within the dashboard and across all its pages. To hide the filters click . Click again to show the filters. To set or change your filters, use the following drop-down options:
- Company Name: Select the companies you want to see data for or select “All” if you want to see data for all companies in your org.
 Configuring Companies
To ensure that data for both Foundations and Accounting companies is available for display, you must enable the following features for Accounting and Foundations using the Feature Console:
- Foundations Publications and Subscriptions.
- Accounting Publications and Subscriptions.
For more information on enabling and disabling features using the Feature Console, see the Accounting Help.
In addition, you must configure publications and subscriptions between Foundations and Accounting companies. To do this:
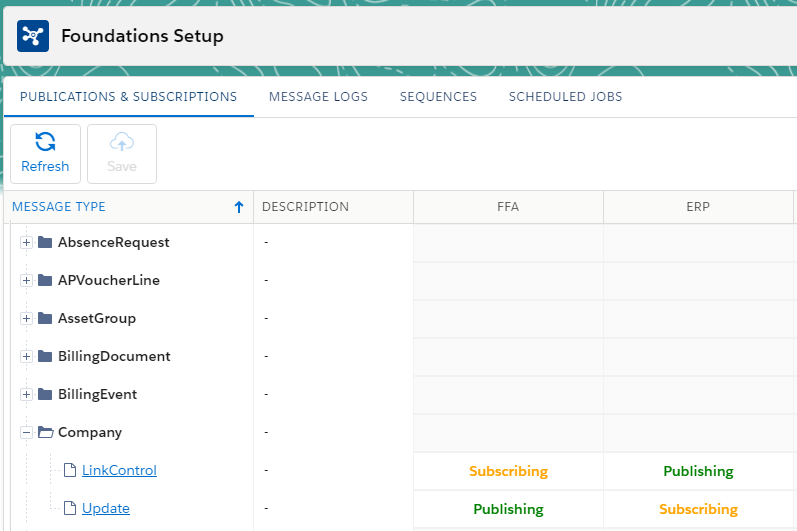
- Click the Foundations Setup tab in the Foundations Administration app.
- Click the Publications & Subscriptions tab within the Foundations Setup tab.
- Select Company. The following publishing and subscribing options must be enabled:
- Product Family: Select the product you want to see data for.
- Product Name: Select the product name you want to see data for.
- Account Billing Country: Select the account billing country you want to see data for.
- Account Industry: Select the account industry you want to see data for.
- Account Name: Select the account name you want to see data for.
Setting Notifications
Notifications are great to keep track of changes and thresholds. To add a notification to a KPI or chart:
- Hover over the KPI or chart you want to attach a notification to and click
 .
. - Select Set Notification to open the New Notification panel.
- Fill in the description, criteria, and frequency used by the notification query.
- Click Save to finish, or click Save and Run to test your notification.
As per Analytics functionality each user can set up to ten notifications. For more information on notifications, see the Salesforce Help.