Revenue Forecasting Overview
Revenue Forecasting enables you to generate project and opportunity revenue forecasts. These forecasts use snapshots of the constantly changing "live" data in your org. You can run them on demand at the click of a button or schedule them to run at set intervals, such as daily. For more information, see Running Project Revenue Forecasts, Running Opportunity Revenue Forecasts, and Scheduling Revenue Forecasts.
You can also schedule PSA to take static snapshots of this data at regular intervals. These snapshots are known as "revenue forecast versions". They show the revenue forecast data as it was at a specific point in time, covering a specific forecast period, for example the current quarter. You can compare different revenue forecast versions to identify changes in the data over time and you can also change the data using management adjustments to reflect risk and upside in best case, expected, and worst case scenarios. For more information, see Scheduling Revenue Forecast Versions and Reviewing Revenue Forecast Versions.
If you use Revenue Management, an integration is available between Revenue Management and PSA for revenue recognition actuals. For more information, see Integration with Revenue Management.
If you do not use Revenue Management, some setup is required to make sure the correct records are identified by PSA for inclusion in the revenue forecast calculations. For more information, see No Integration with Revenue Management.
You can use the Revenue Forecast dashboard available in PS Cloud Analytics to report on and visualize the following revenue forecast metrics:
- Display forecasted revenue broken down by actual, scheduled and unscheduled revenue.
- Review versions of forecasts for your organization within PSA.
- View comparisons of your live forecast against a saved version, or comparisons of two saved versions.
- Filter forecast versions by Expected, Best and Worst Case scenarios.
- View the value of adjustments made to projects, opportunities and milestones, or aggregated adjustments at RPG level.
For more information, see PSA Revenue Forecast Dashboard.
For an introduction to the Revenue Forecasting functionality, see Finding Your Way Around Forecasting.
For general background information, such as custom objects used, required permissions, exchange rates, and rounding of values, see Forecasting Basics.
Process Outline
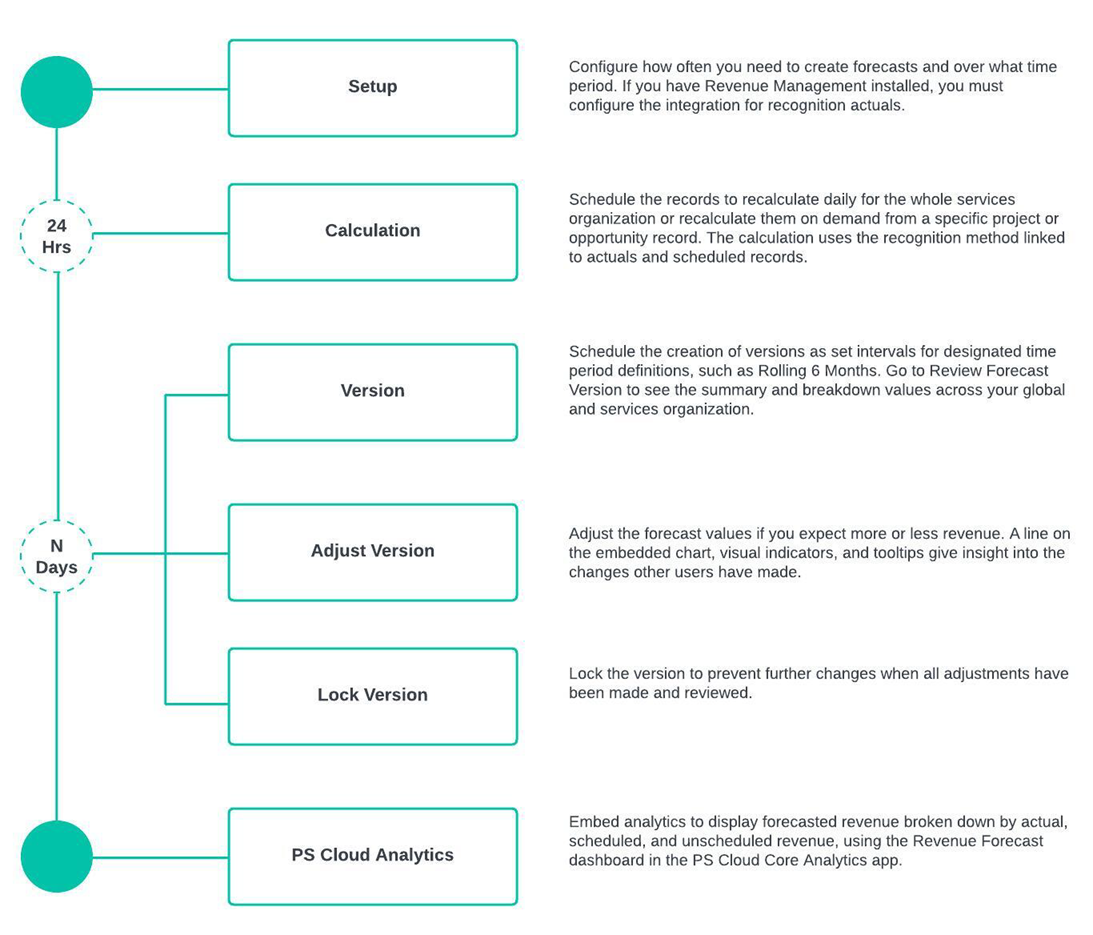
The following diagram gives an outline of the Revenue Forecasting process.
Click a box on the diagram to go to the relevant topic and view more detailed information. To return to this page, click Back on your browser.

 SECTIONS